
Analyzing Apple Health Data in Plotly Studio
Apple Health has a treasure trove of data, especially if you are judicious about logging your workouts.
My colleague and I recently dug into her Apple Health data in Plotly Studio as we were building out Methodology with the broad question:
What workouts worked?
And how good is AI at figuring this out?
After a couple of hours, we found our answer in these two beautiful charts.
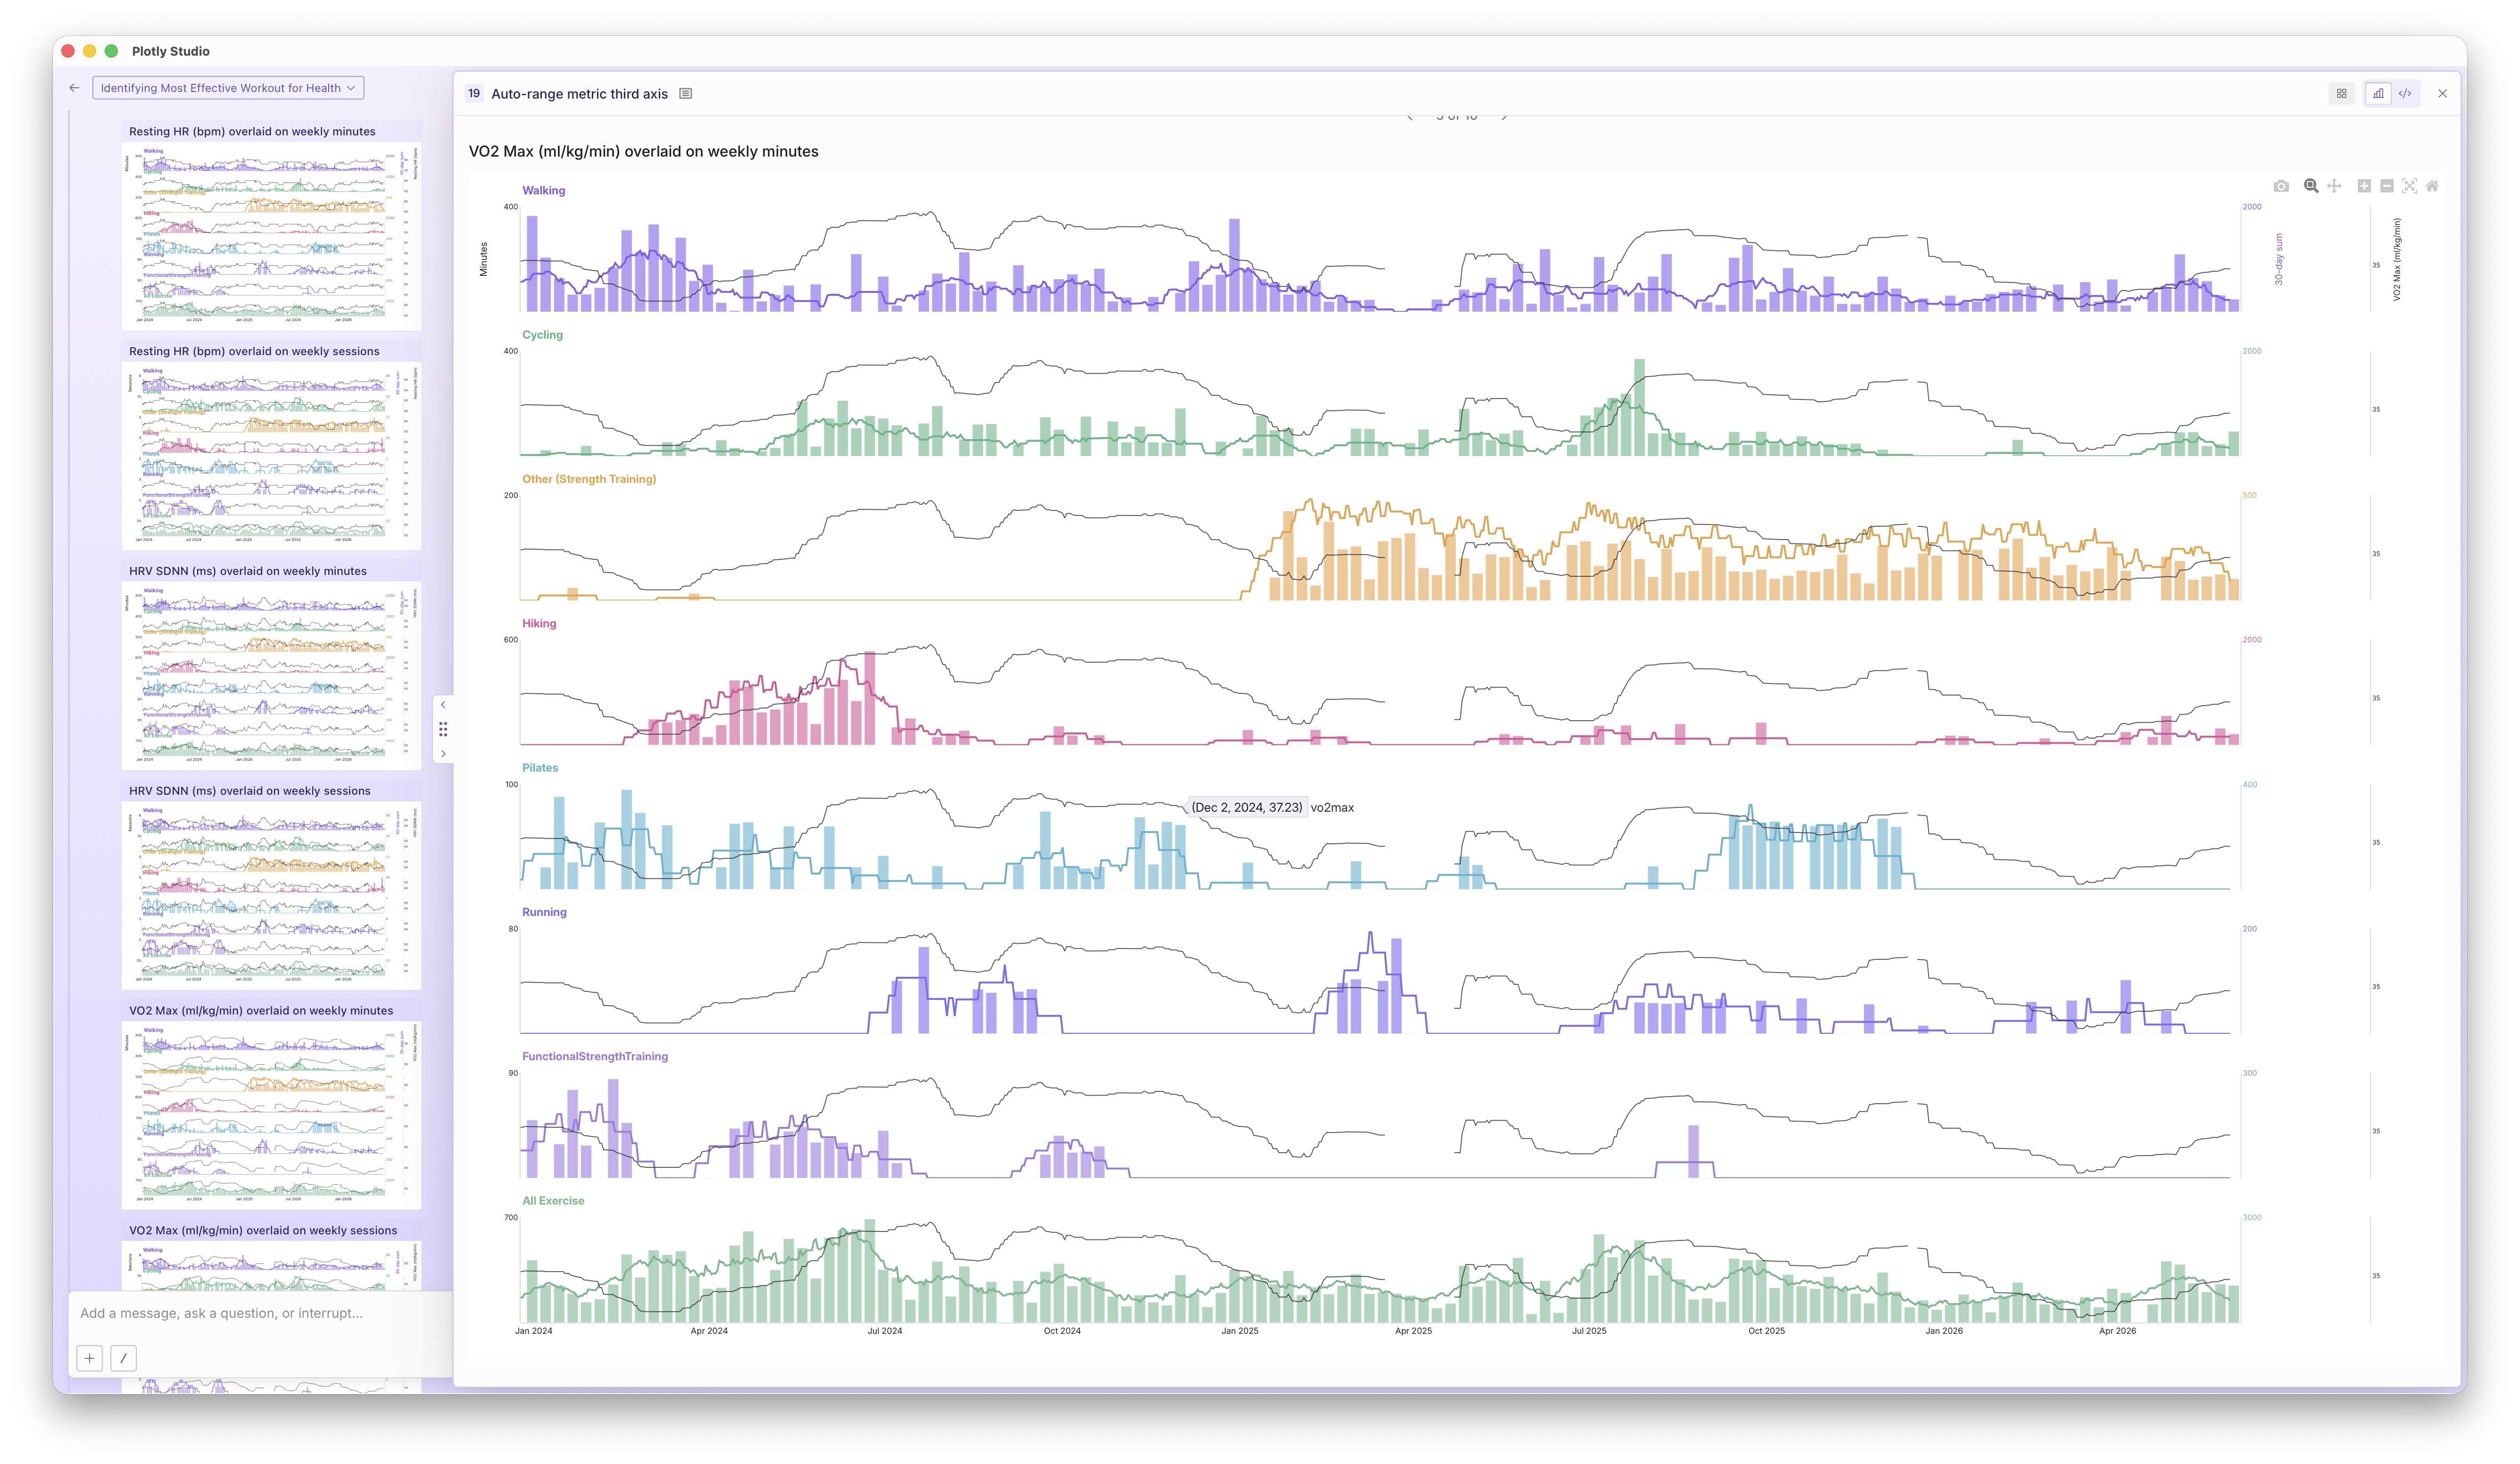
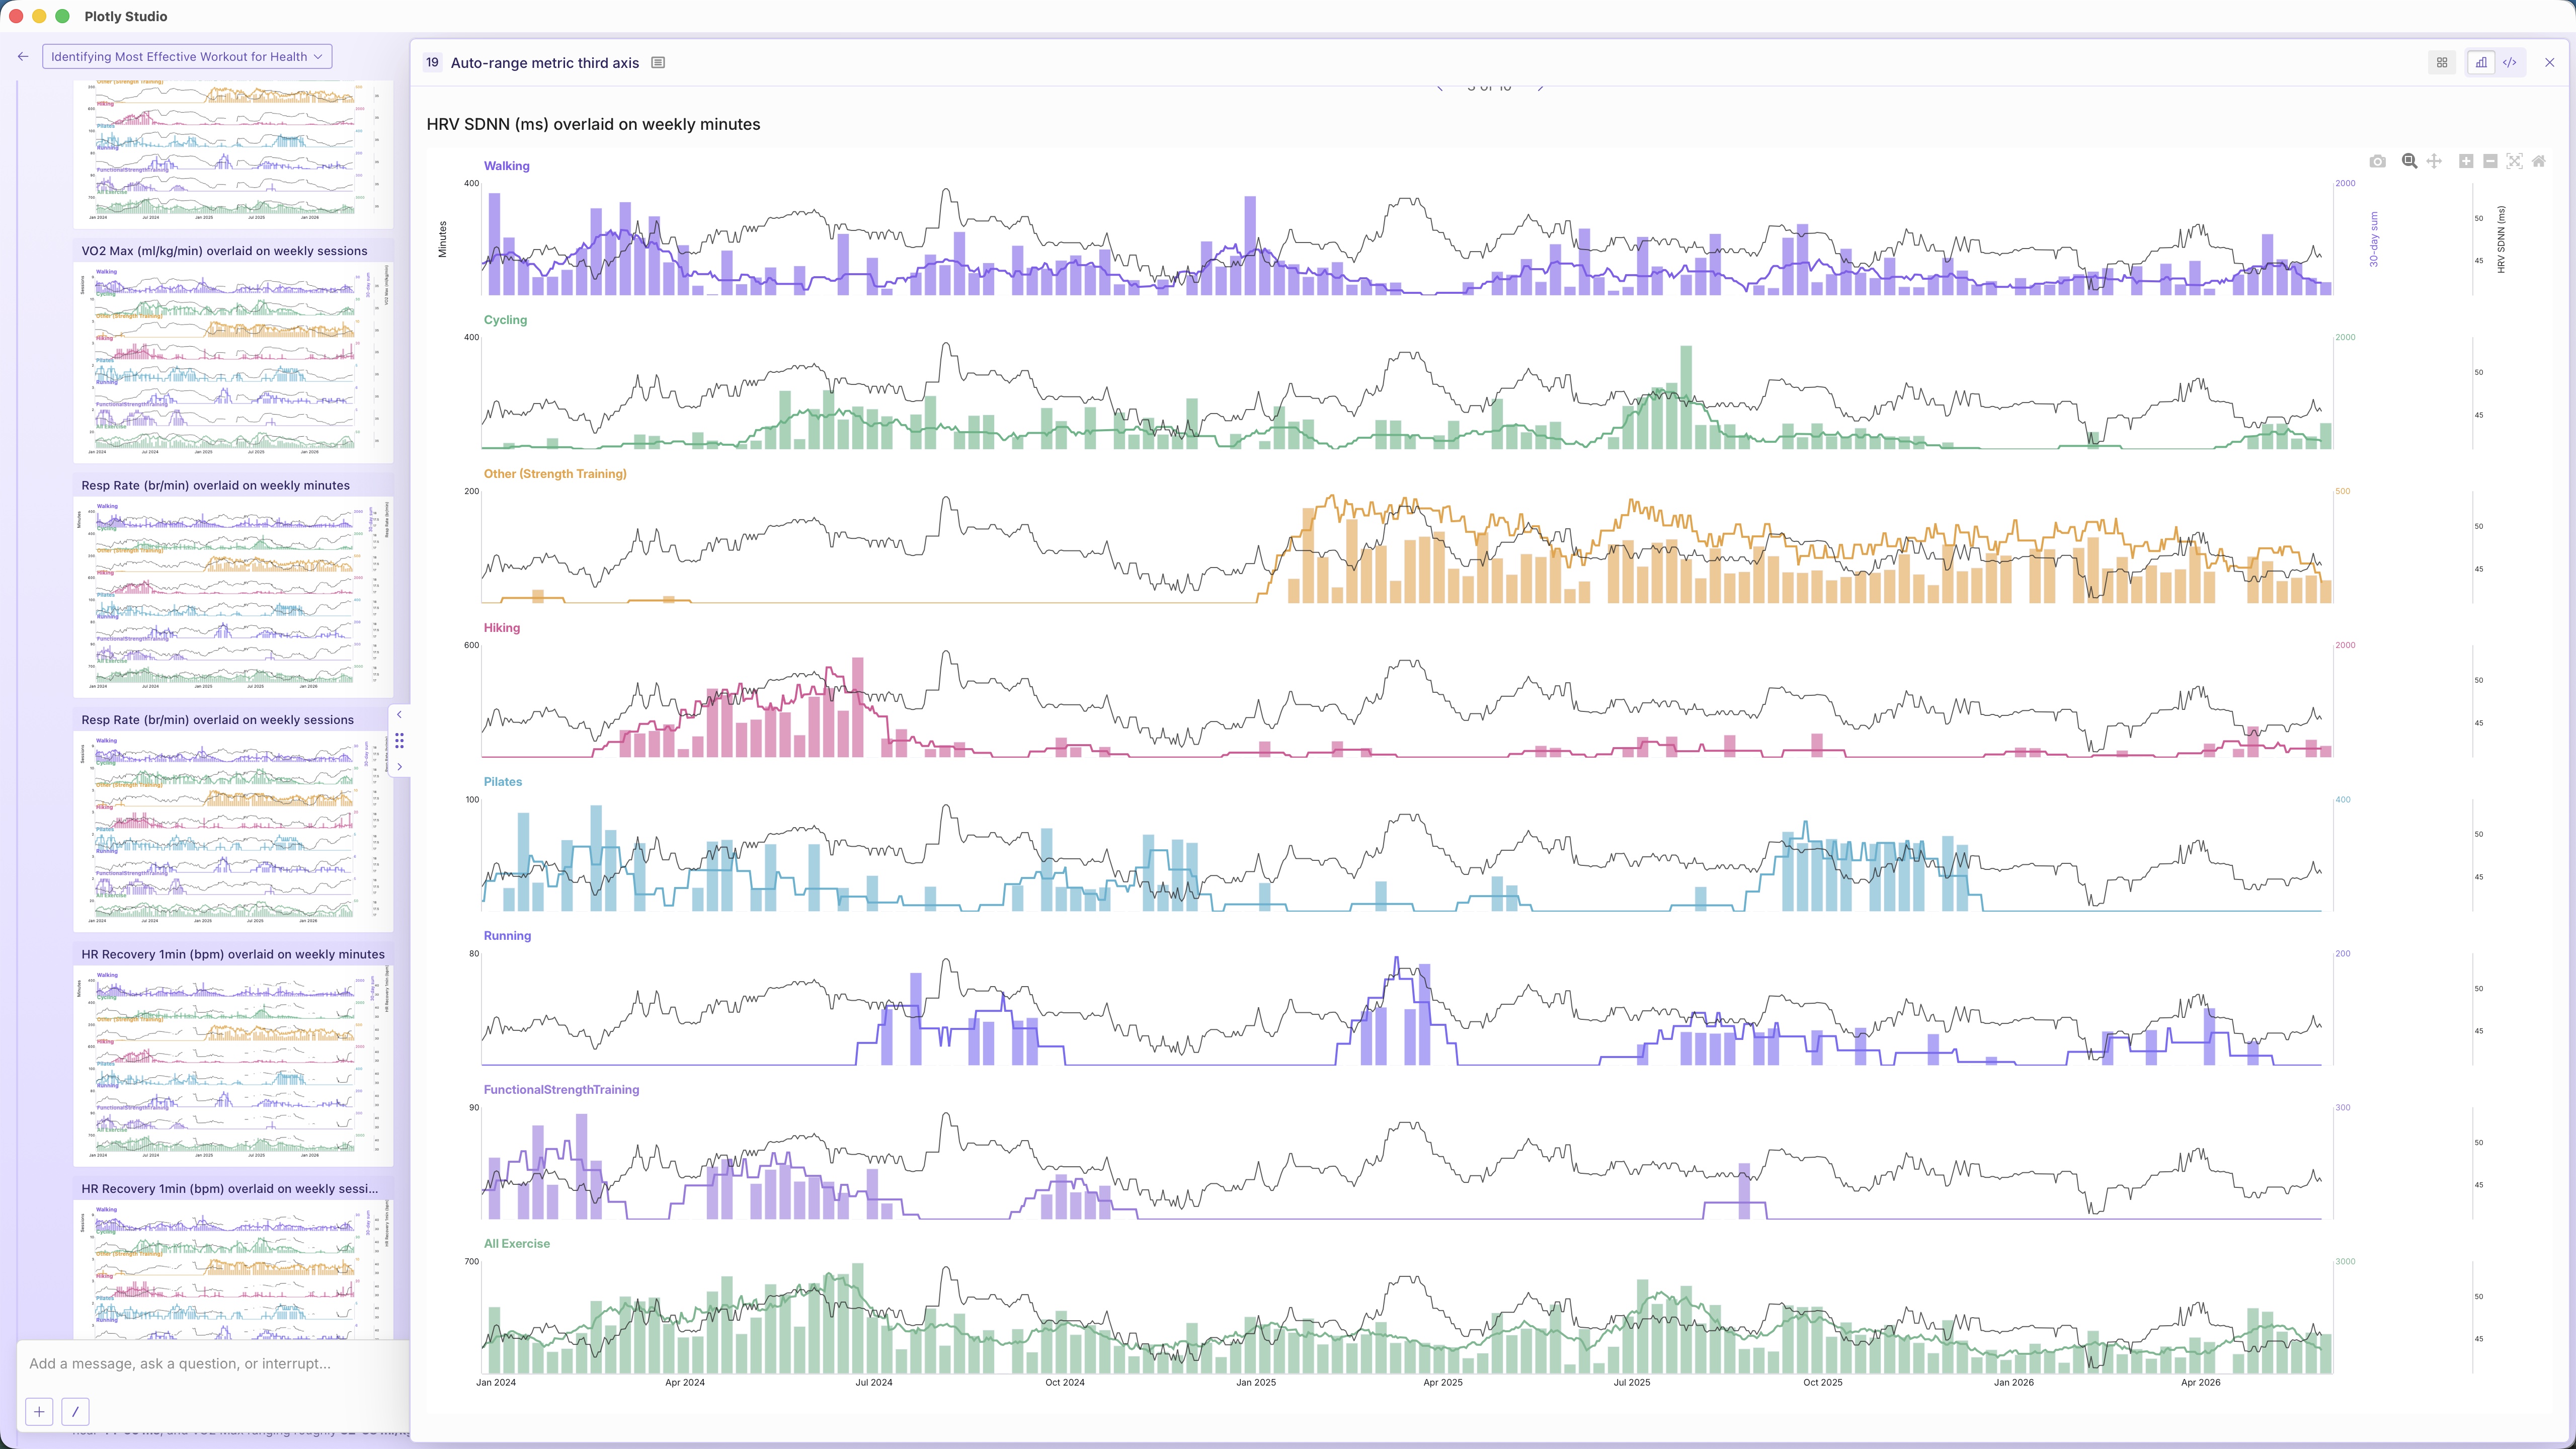
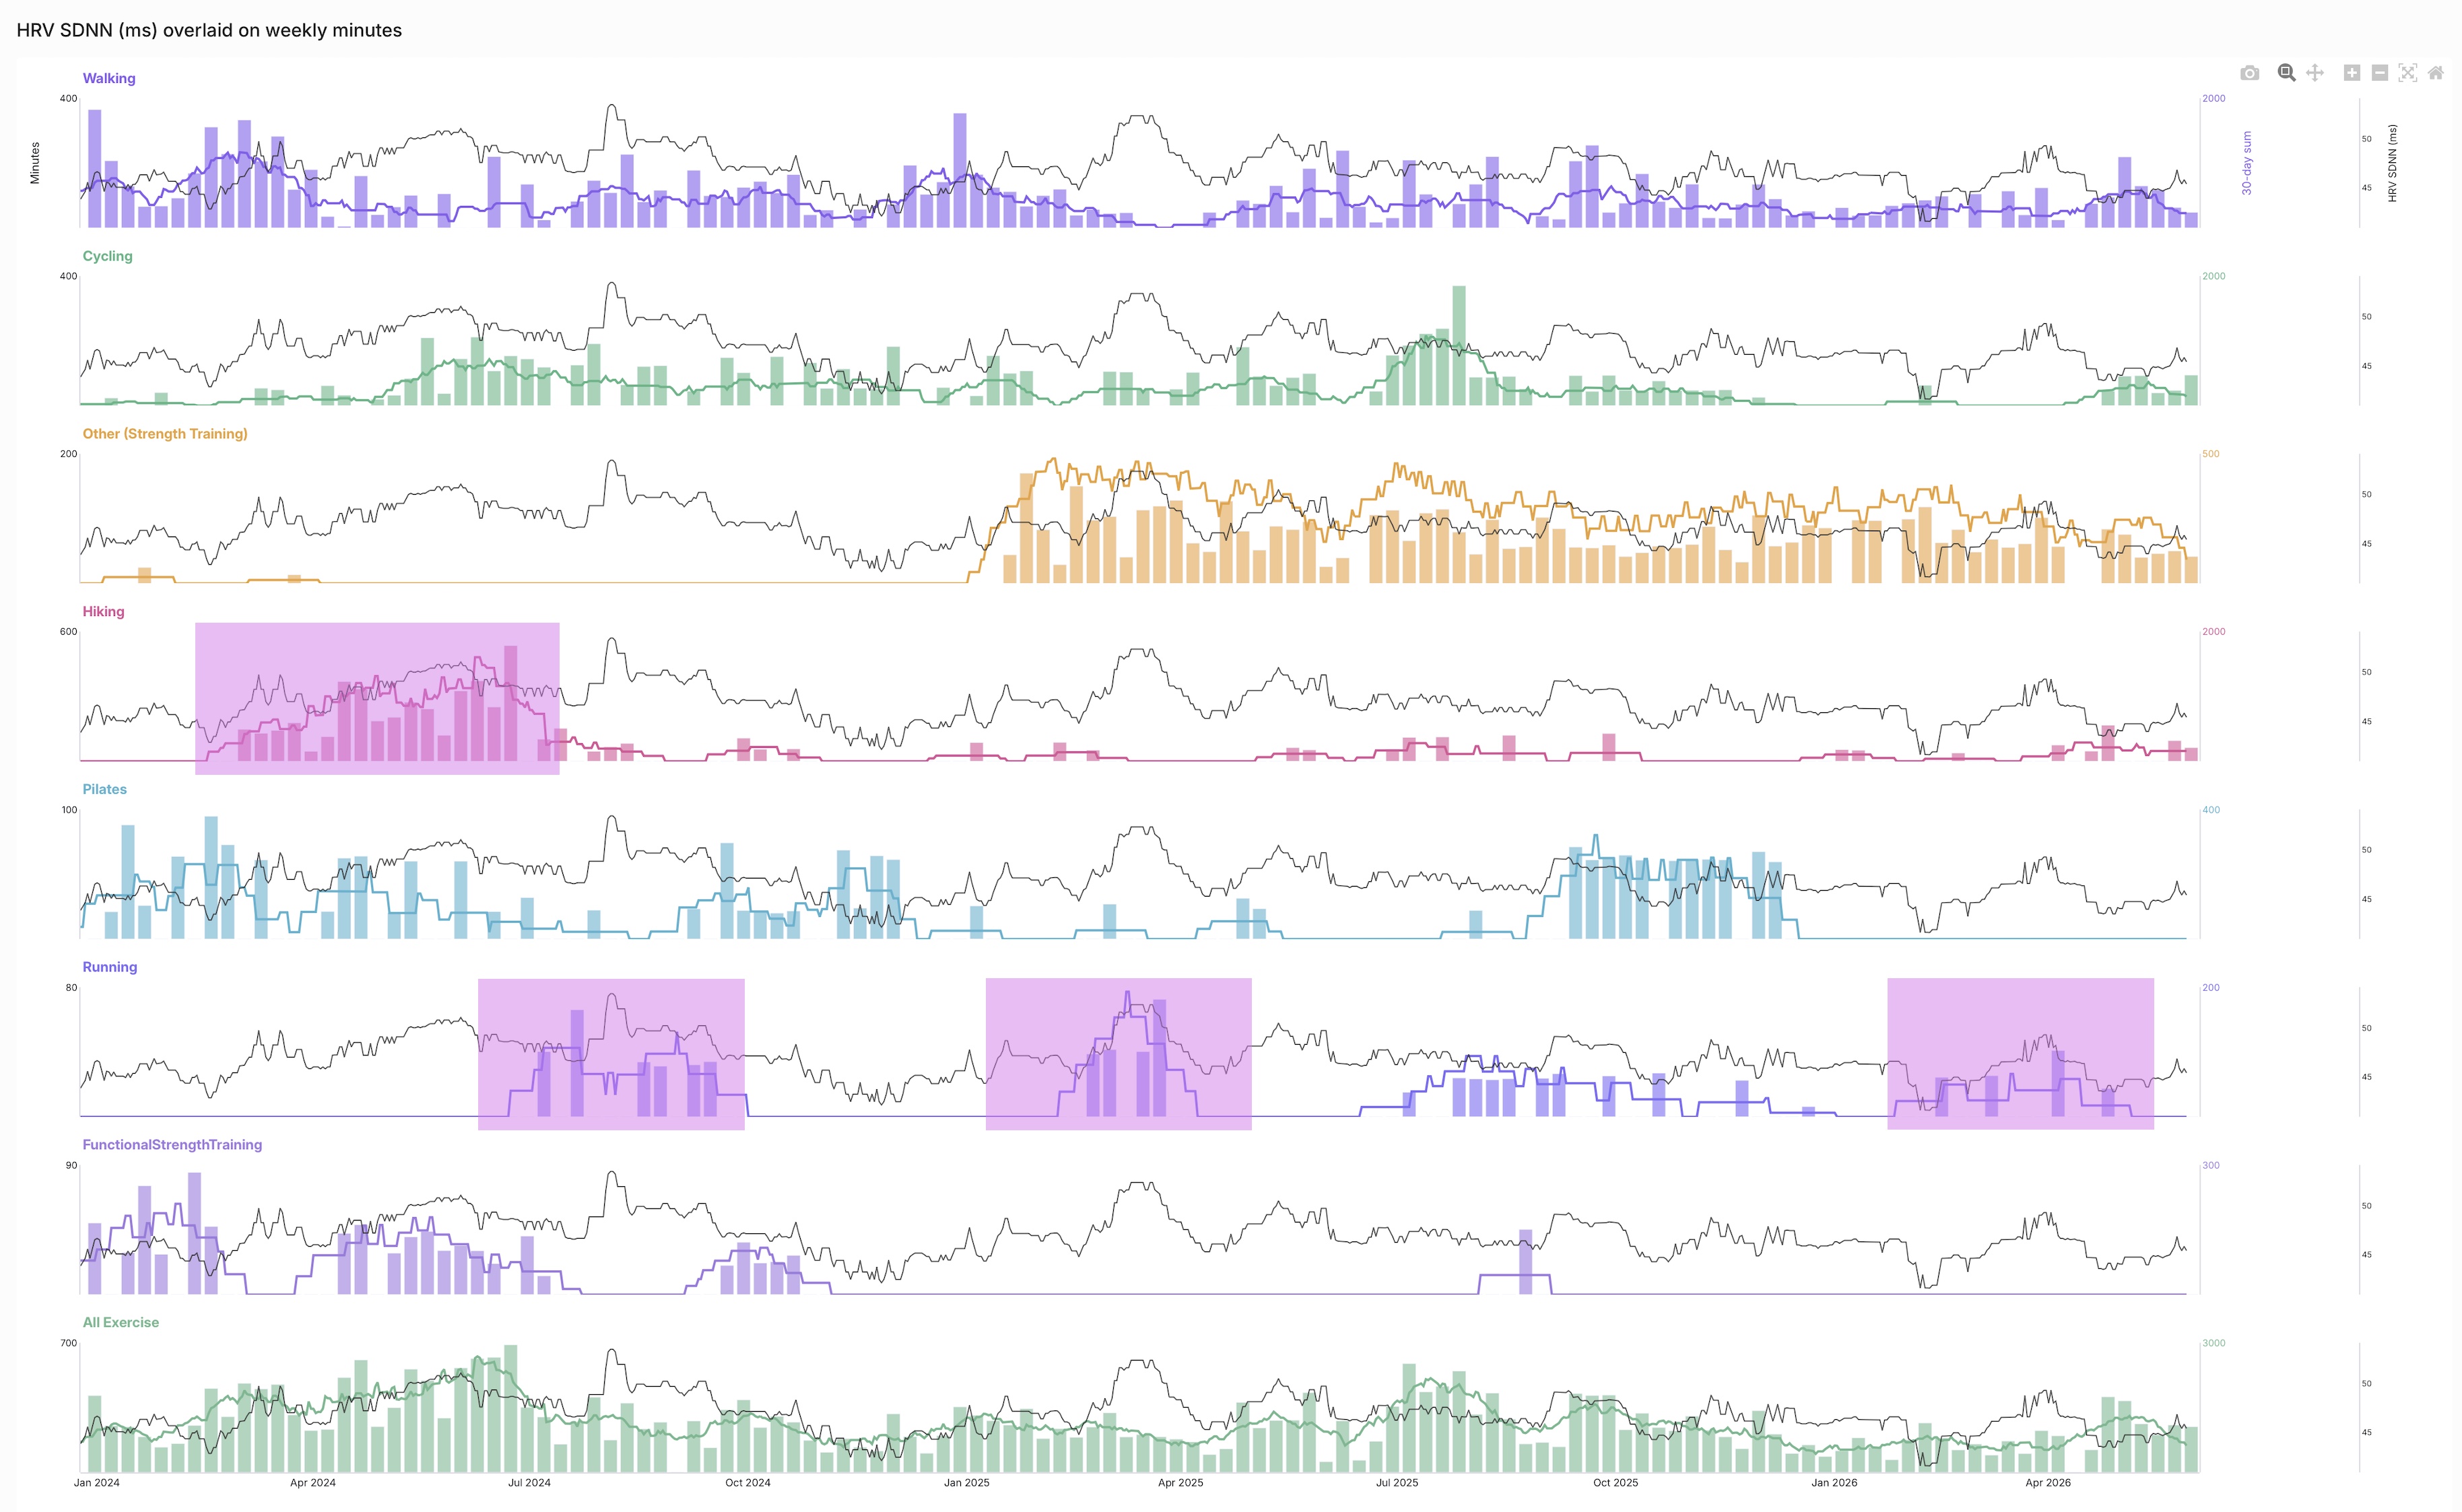
Take a moment and look at the charts. Can you spot which sports lead to the biggest gains in VO2 max or HRV?
Here's what we noticed:
HRV (Heart Rate Variability - a sort of "nervous system" measure of rest, fitness, and adaptability) increased every time she introduced running into her training (higher is better). The impact was immediate. Cycling, strength training, and overall exercise load didn't really play any part.
The pattern in this data is especially clear given that running was done in fits and starts.
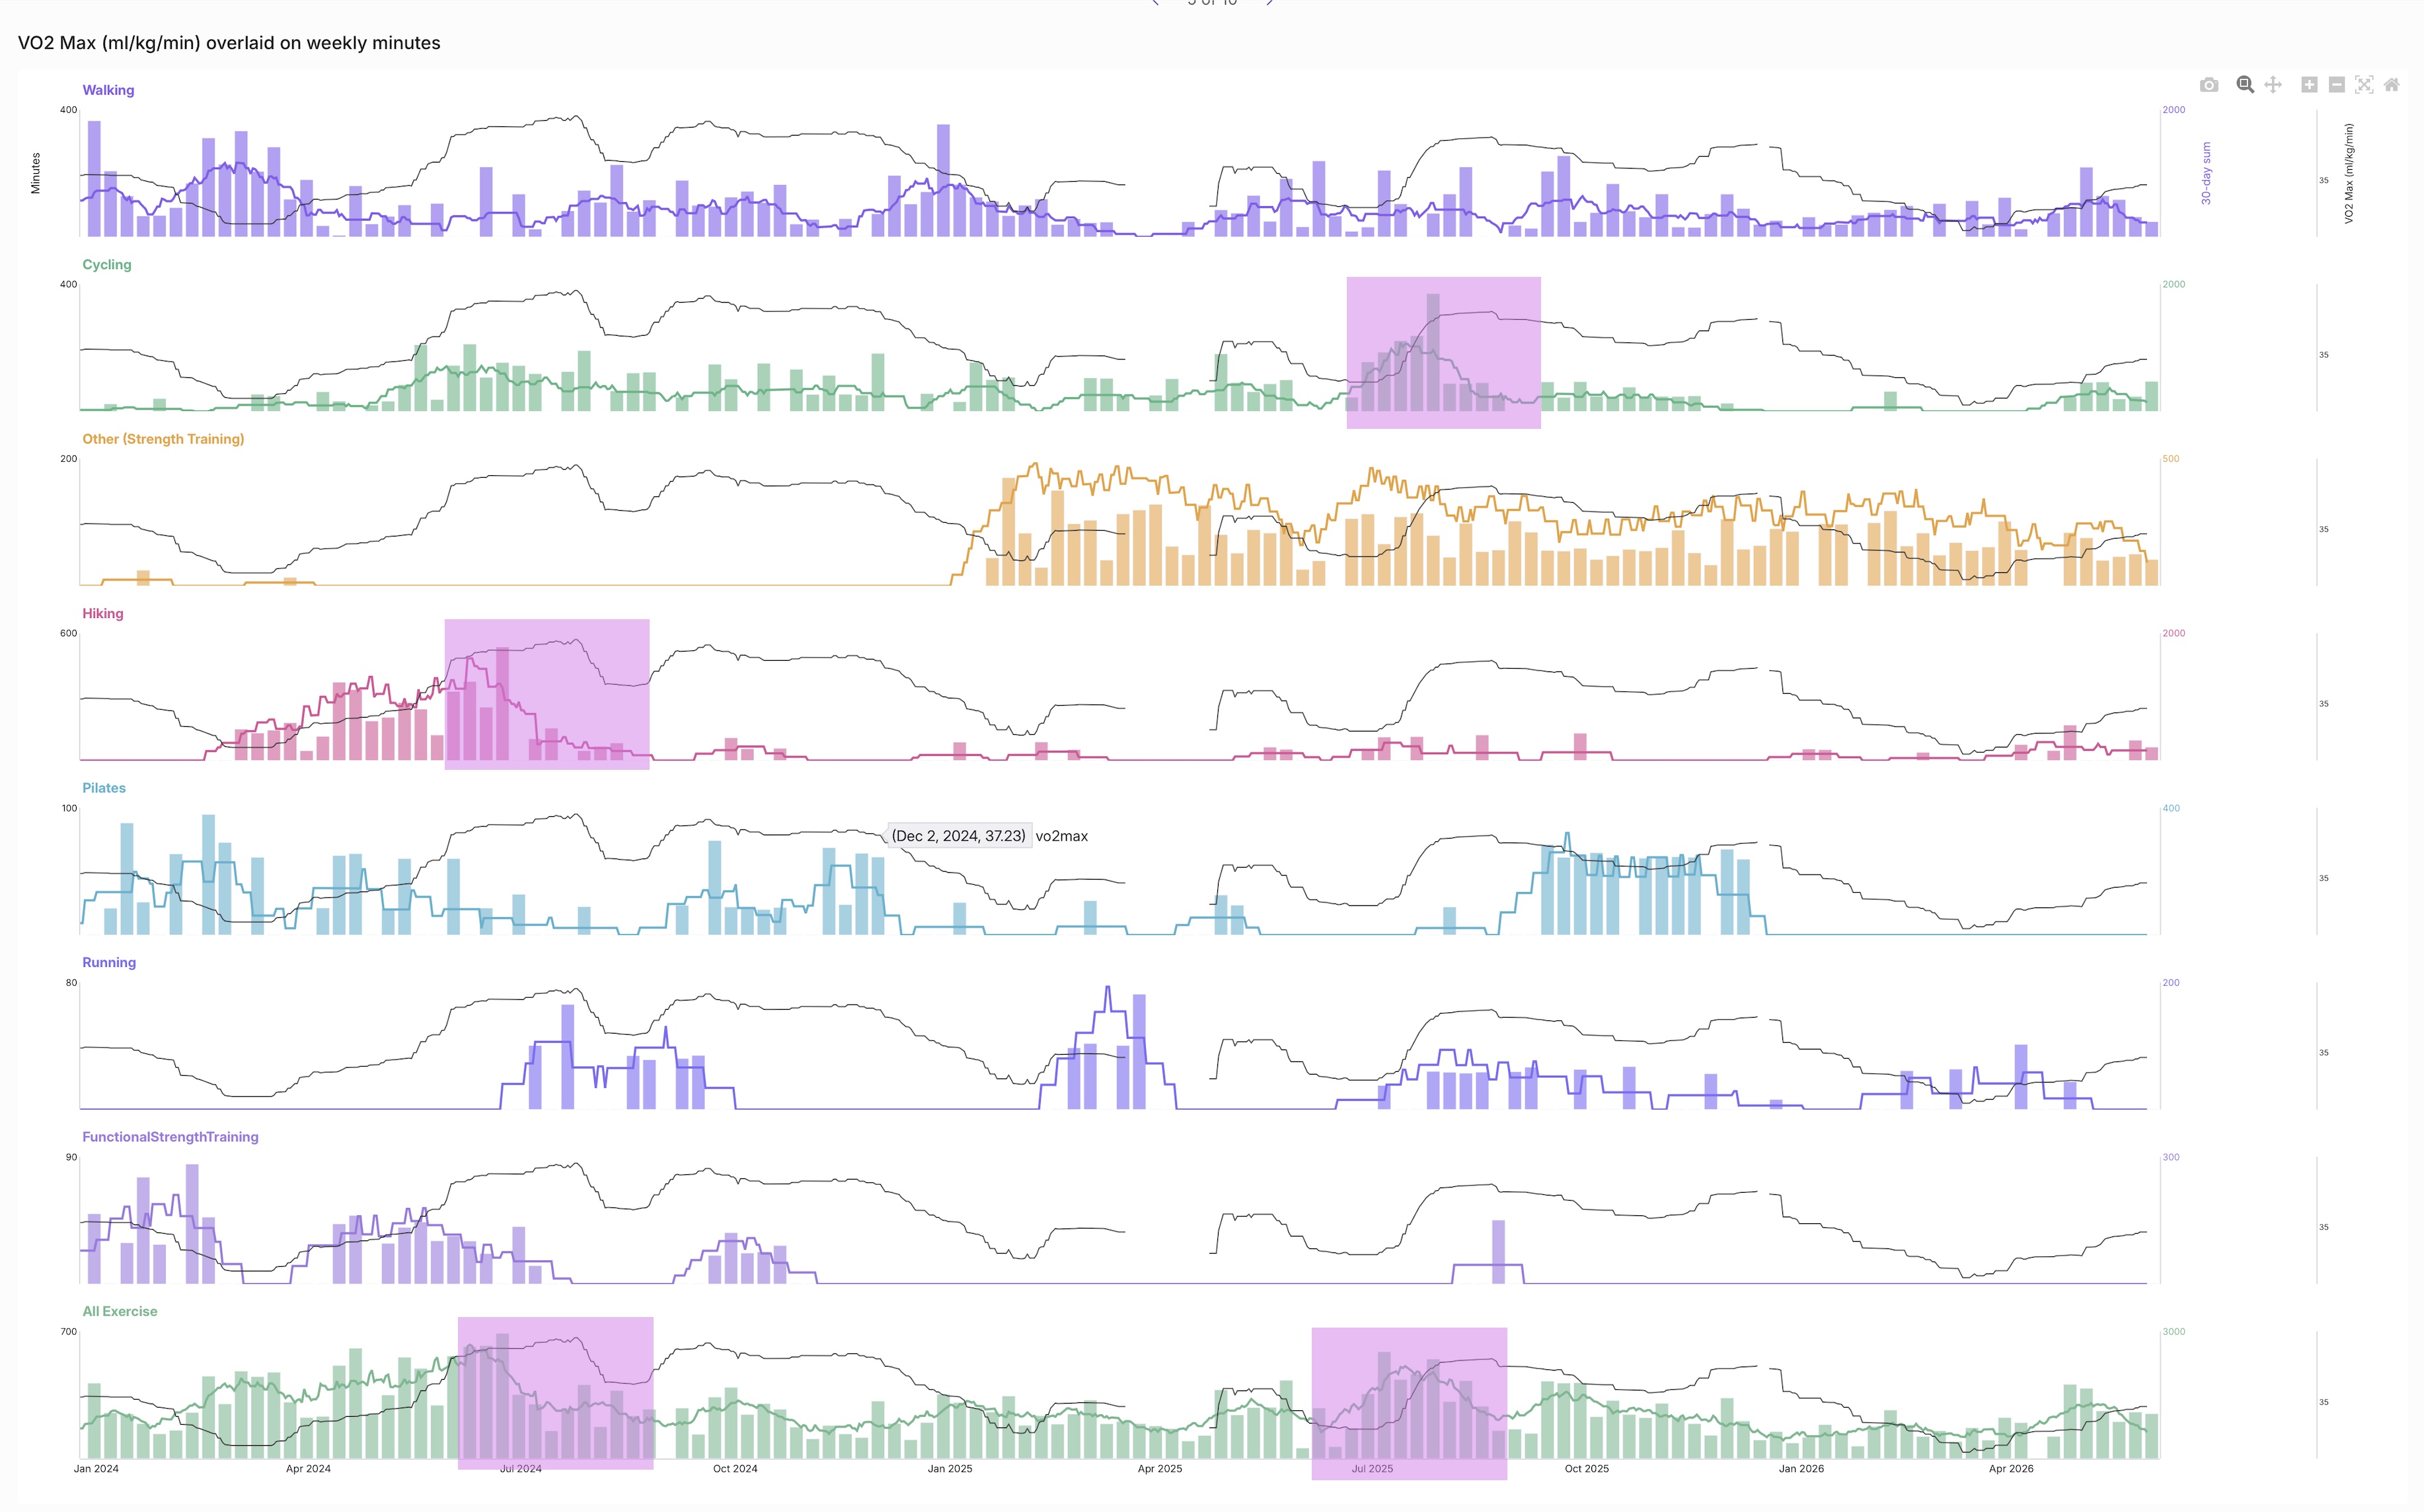
VO2 max (an indicator of respiratory capacity) appears to be a lagging indicator. It increased steadily after a long period of hiking training and cycling-to-work and then decreased after that training stopped. Shorter periods of running didn't have an impact (it appears to need a longer period of training) and strength training also doesn't seem to have an affect.
Resting Heart Rate decreased about 5 BPM from 60BPM to 55BPM during the intense period of hiking training and then went back up to 60BPM after the training stopped. No other sport or period of exercising really seemed to impact this later.
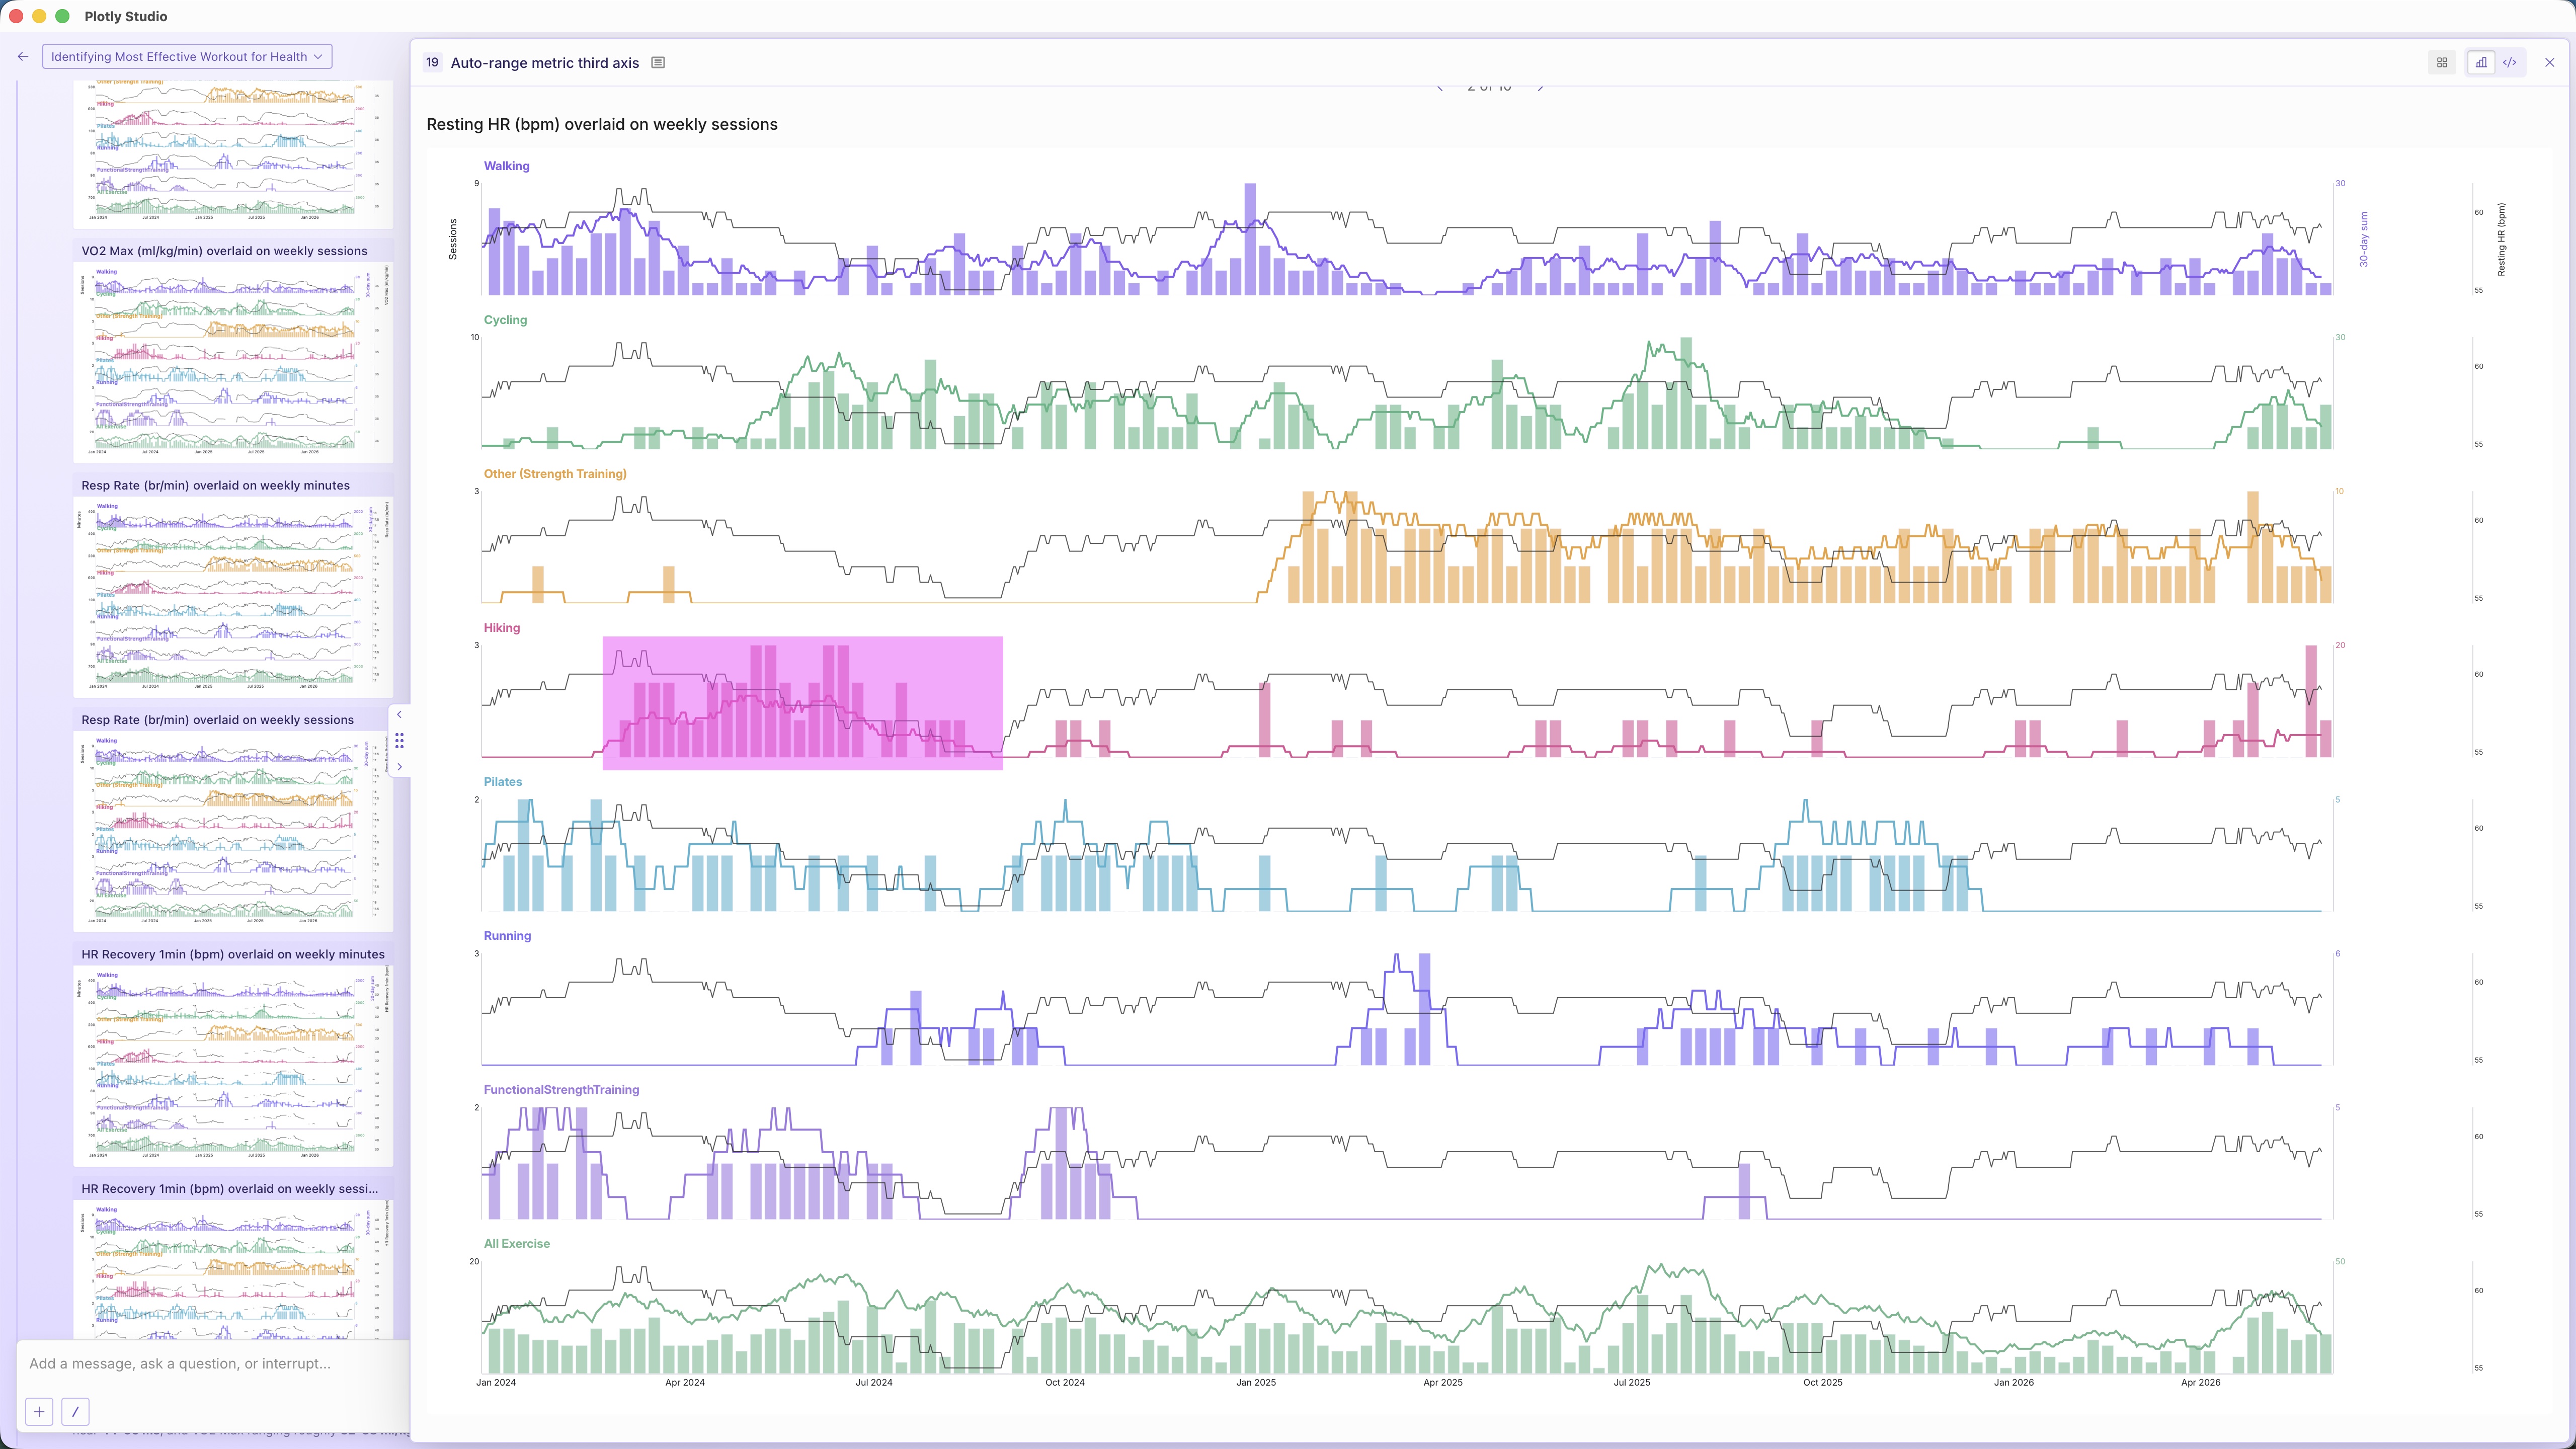
We were pretty blown away by these charts once we put it all together. Turns out running is actually good for you! And how curious that all of her recent strength training didn't really show up in the metrics. Plus, low level cycling to work had a great impact in some measures but not all. I didn't expect to see the patterns so clearly in the charts.
This post will walk through how we made these graphs and what analyzing complex data in the agentic area looks like. It's a tale of lagging correlations, agentic vs augmented data analysis, and the unreasonable effectiveness of data visualization.
Exploring and parsing the Apple Health data in the agentic loop
To start, we explored how well frontier models combined with Plotly Studio's analytics harness would be at answering this question on its own.
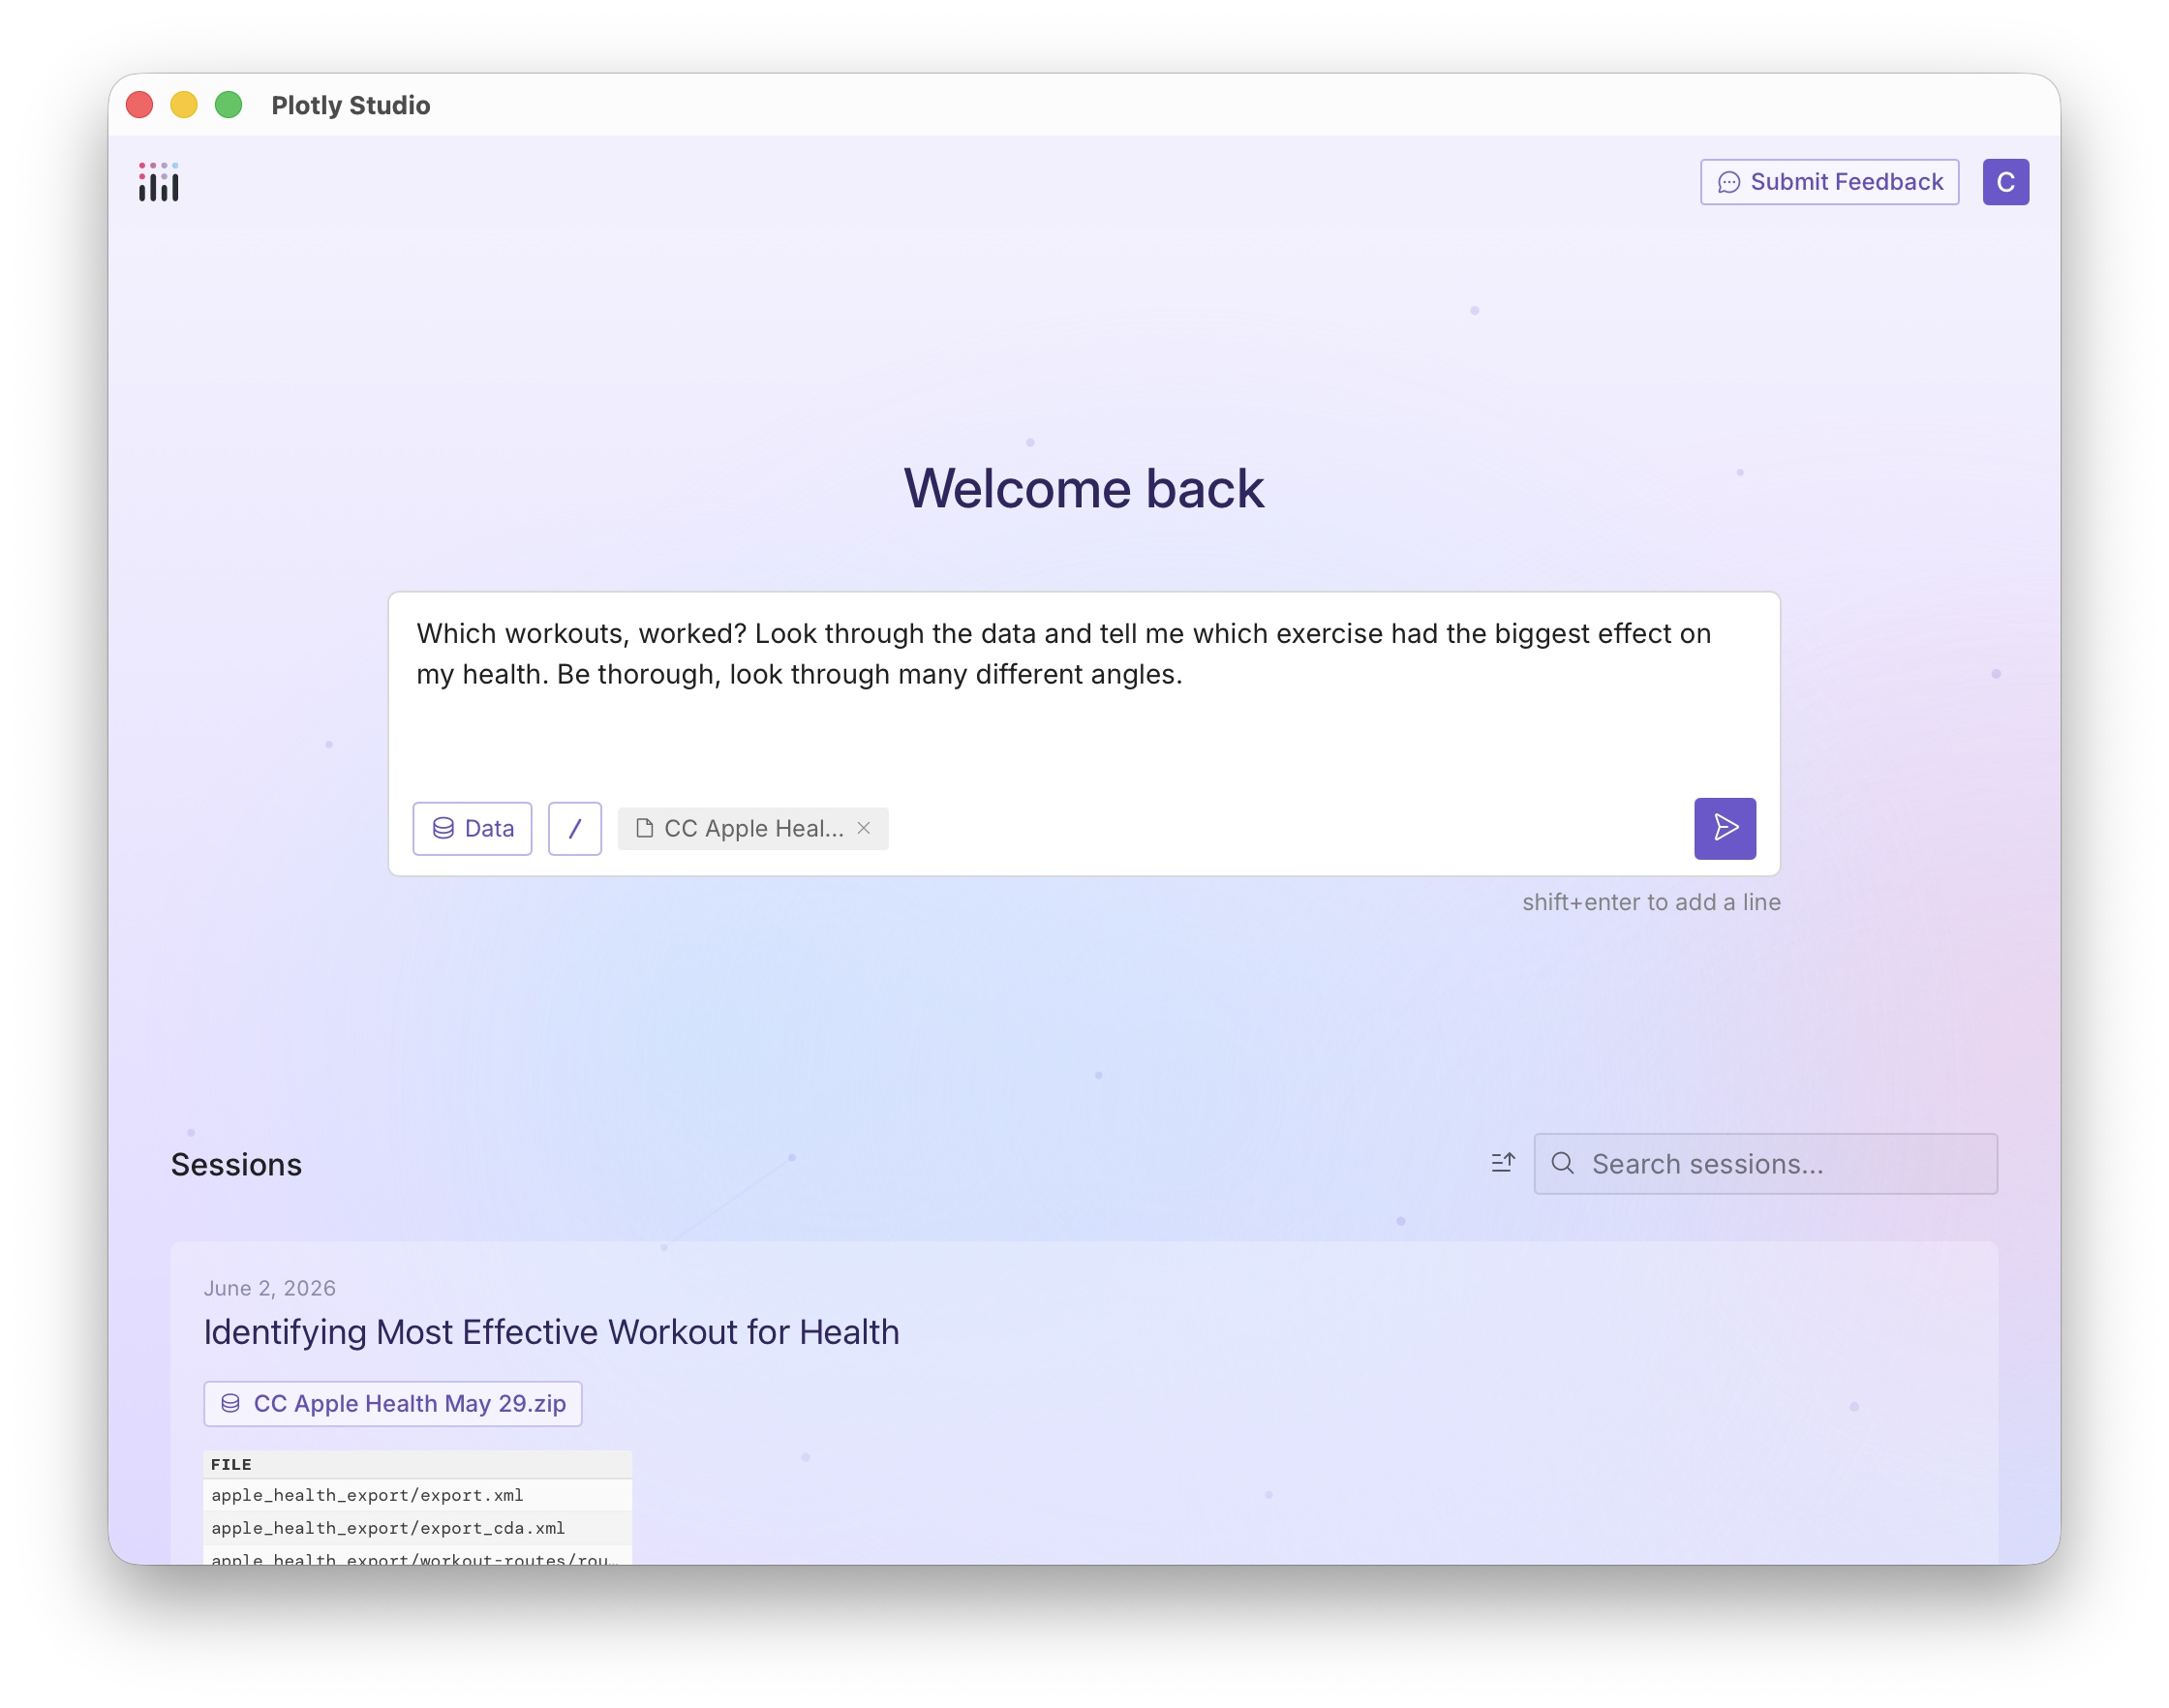
Plotly Studio analyzes and visualizes data through code rather than AI inference. Each step of the agentic loop will generate ~20-200 lines of Python and SQL code to to analyze and visualize the data and present the result. It's code-backed, but no coding is required.
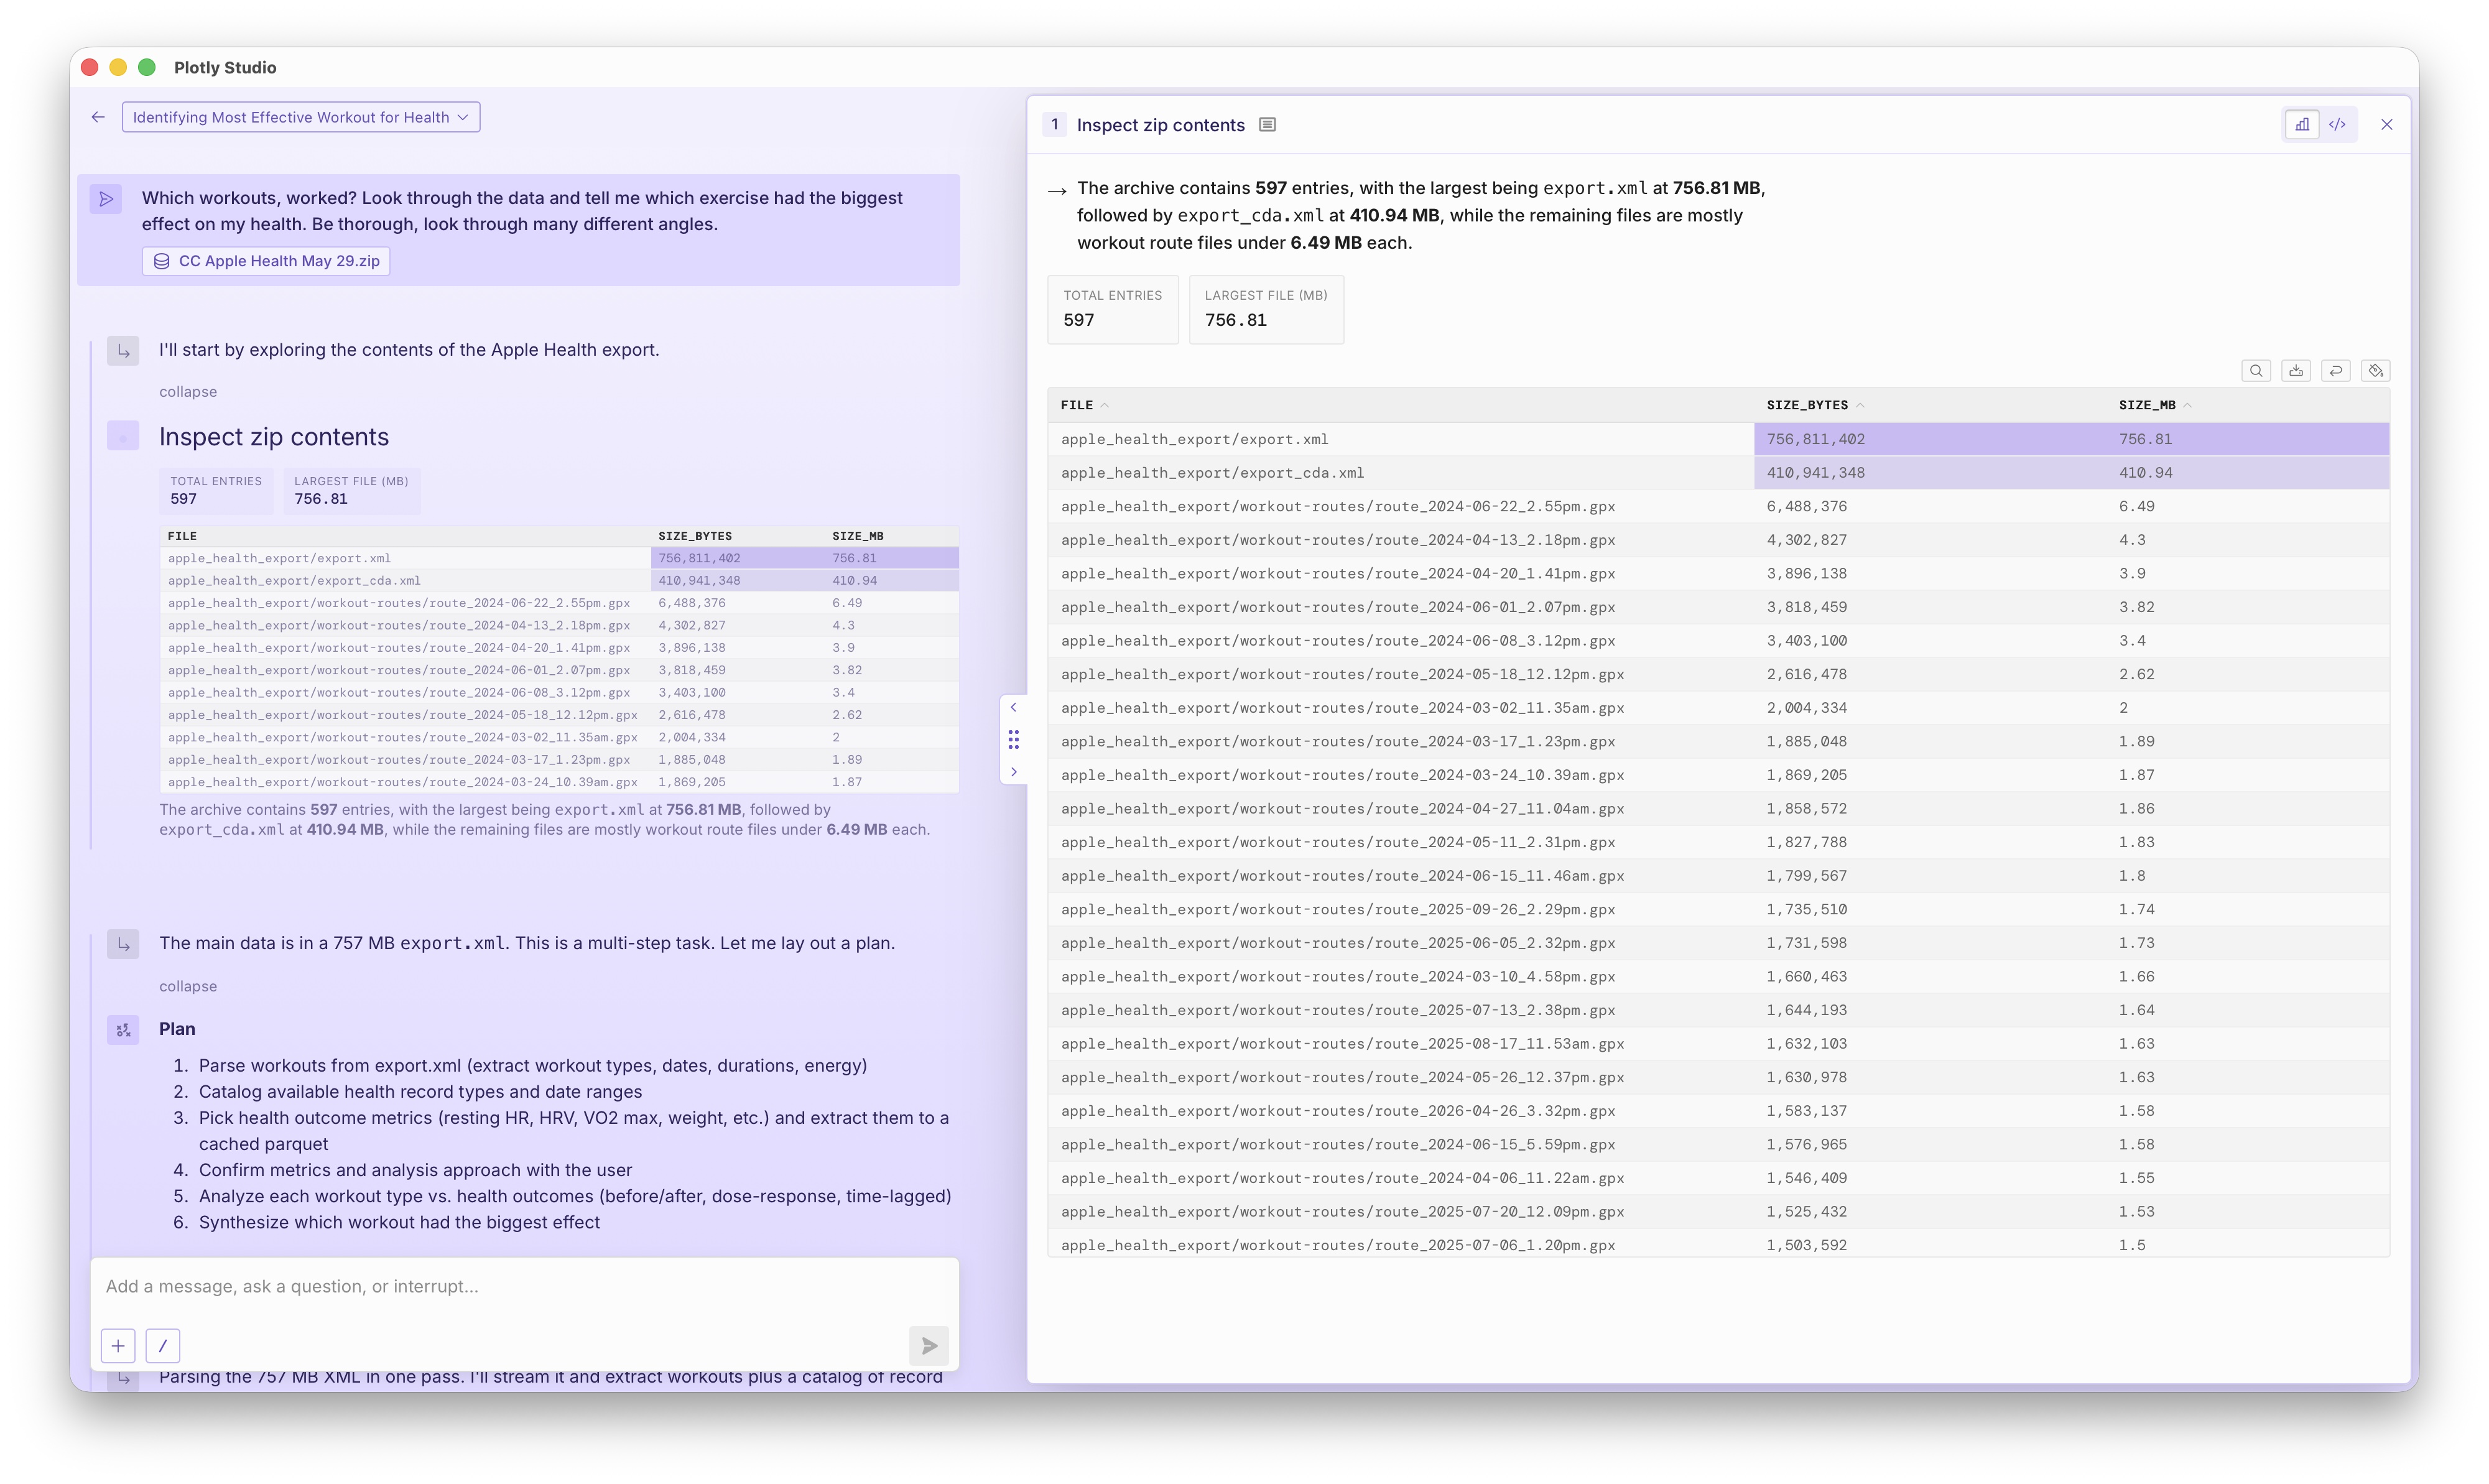
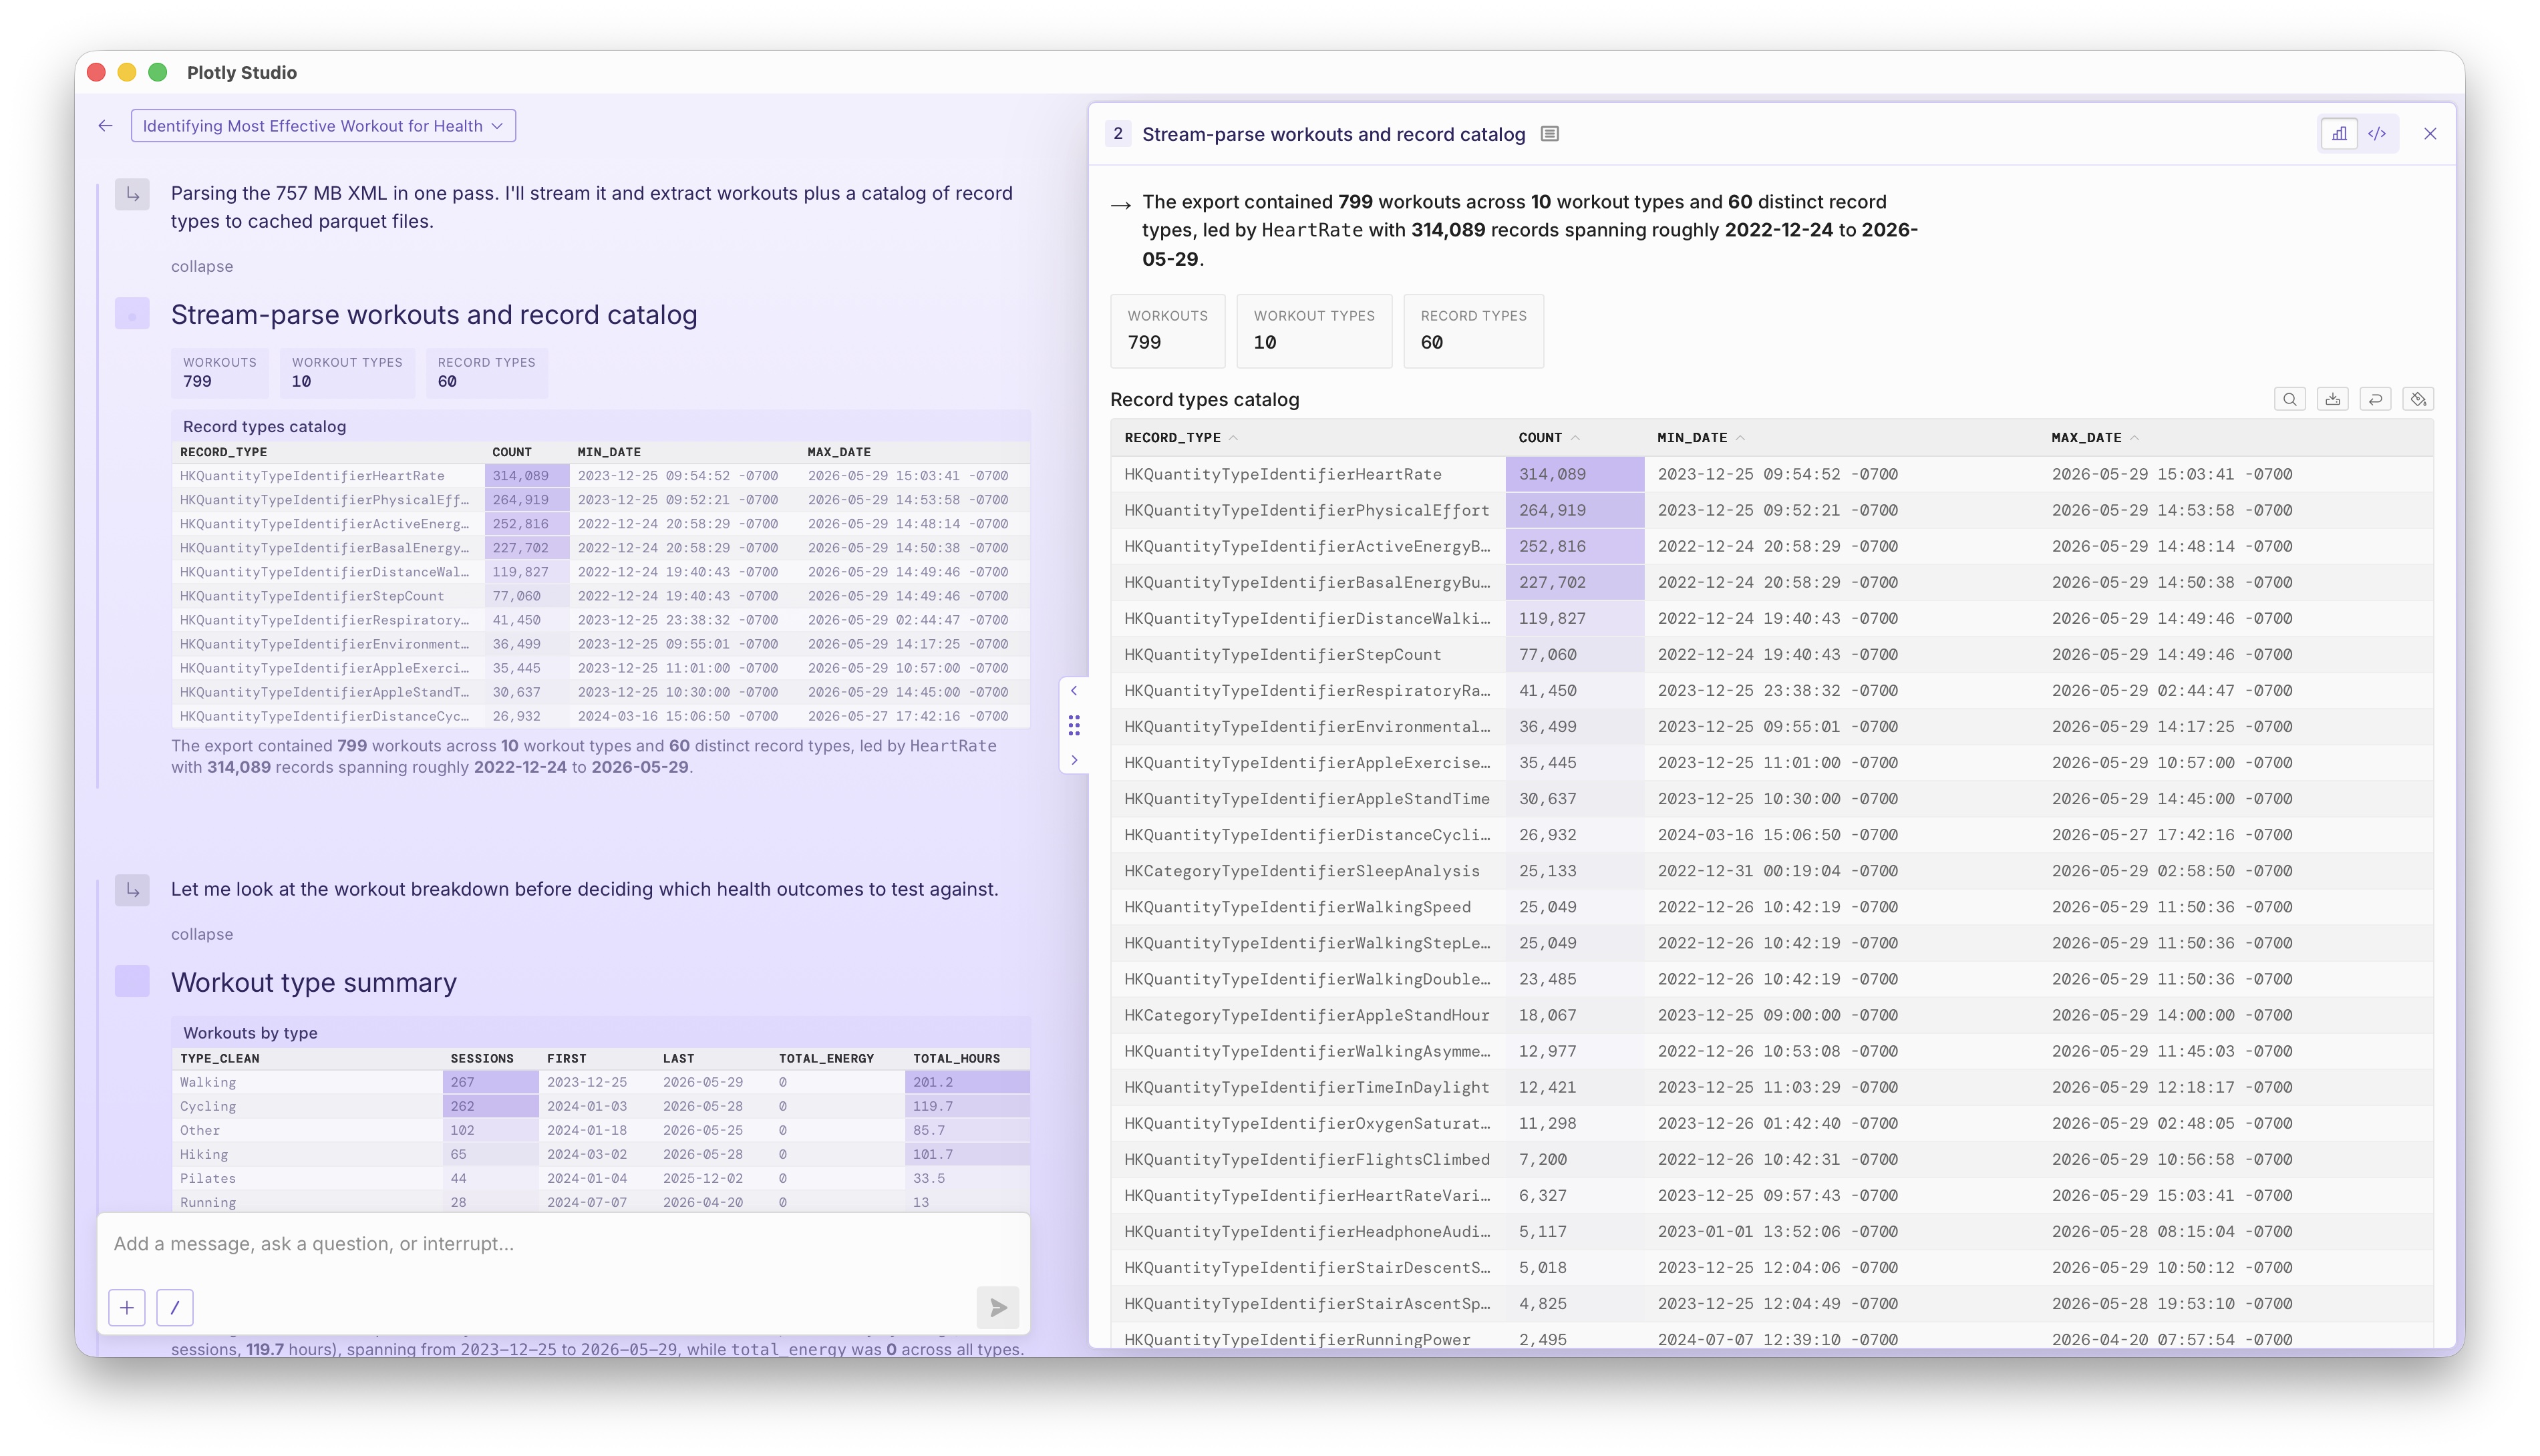
This means that it's remarkable at complex data parsing and analysis. To start, Studio loads, parses, and explores 3 years of Apple Health data entirely on its own.
Questionnaires in the agentic loop
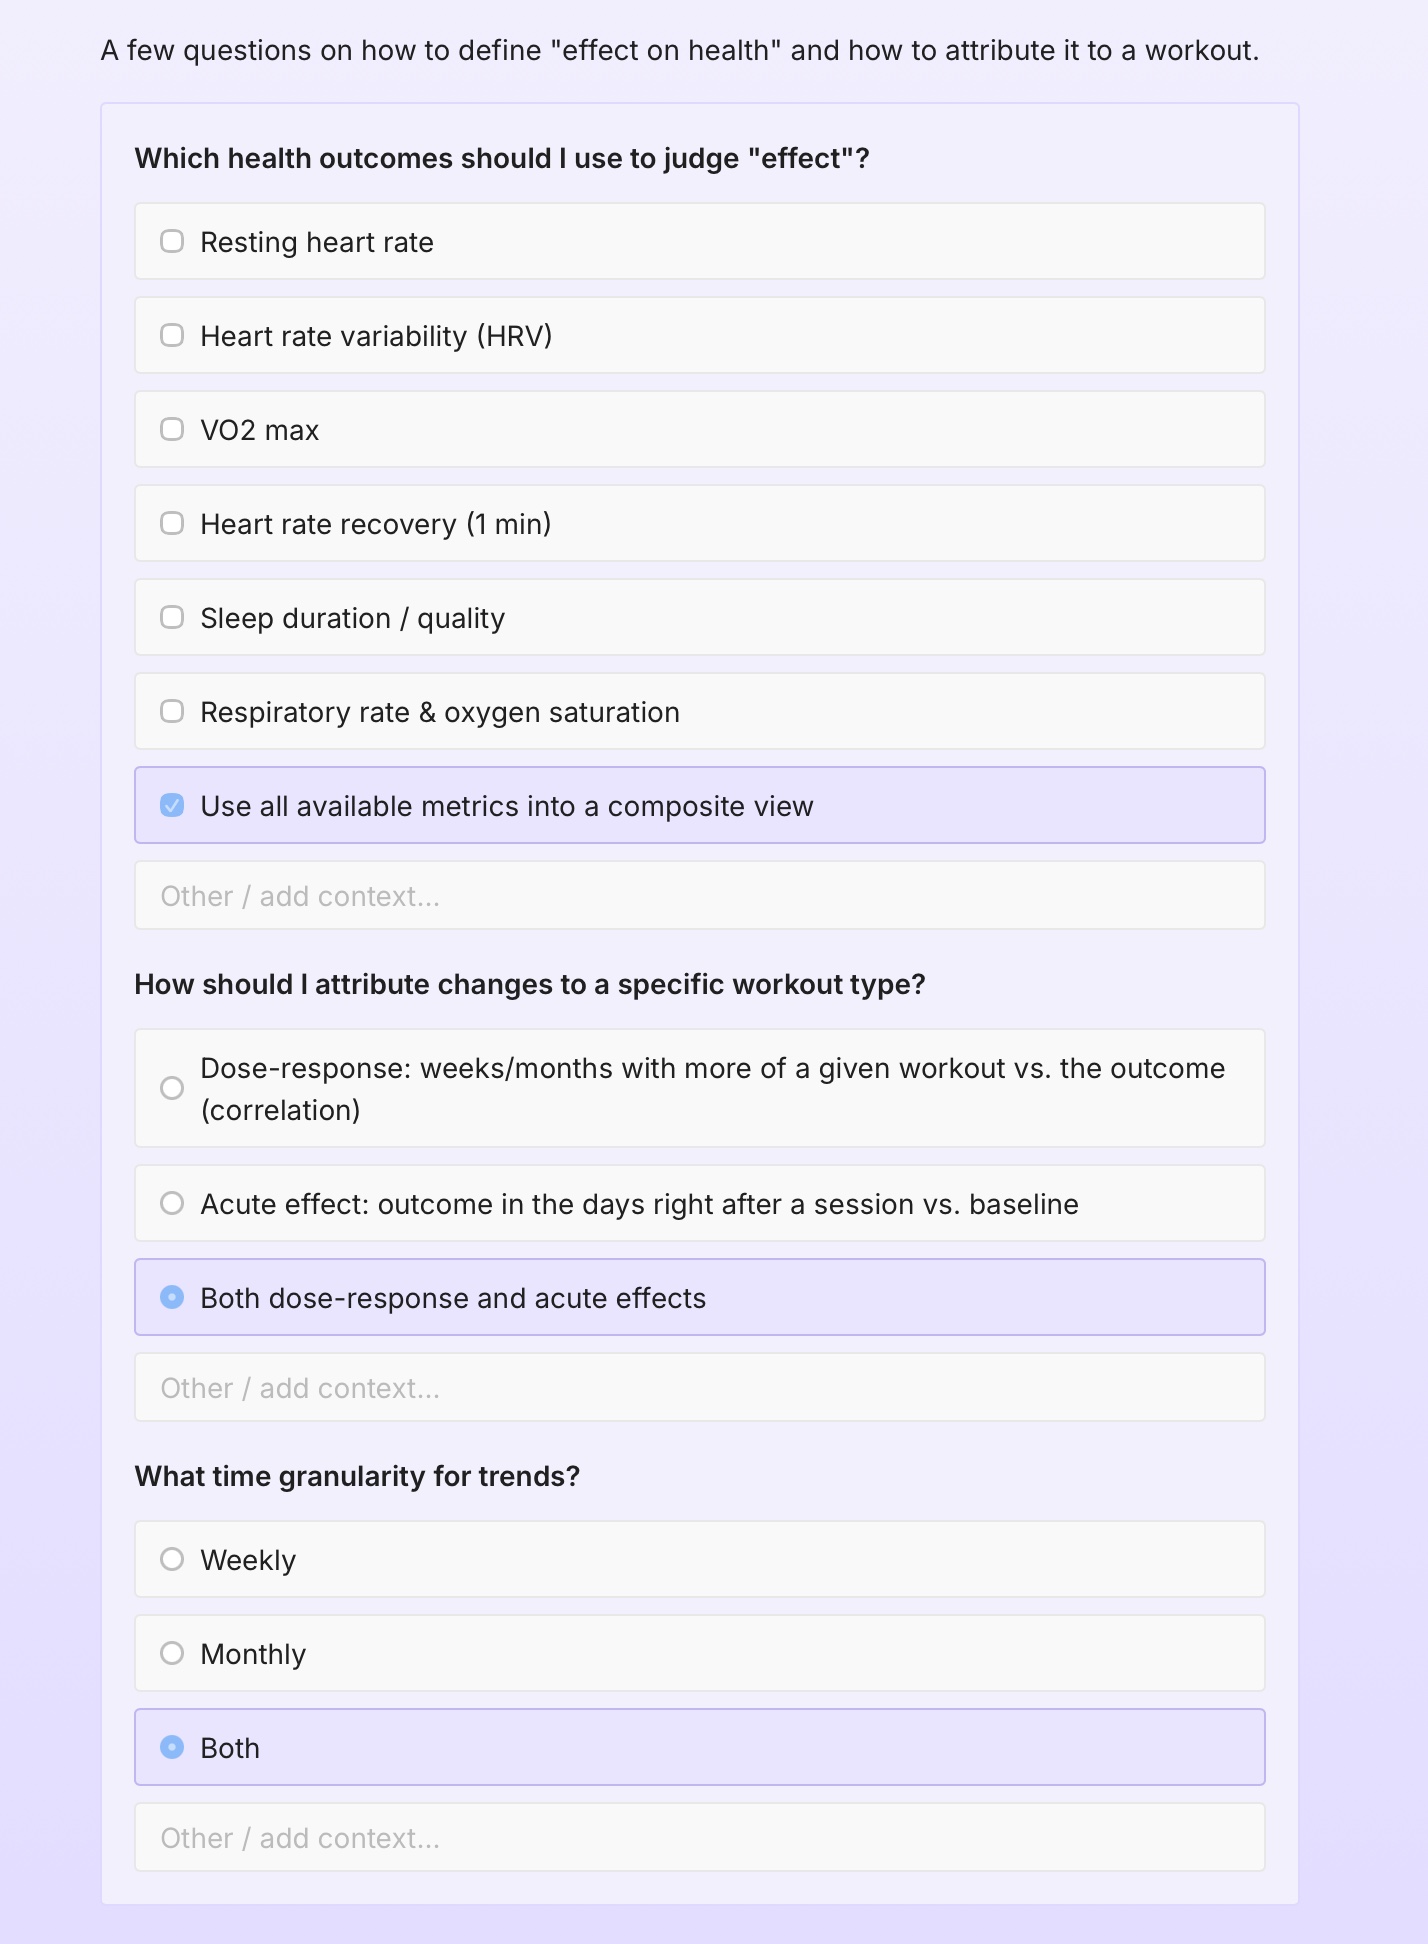
Data is often messy. We've tuned Plotly Studio's behavior to pause and ask questions any time that it encounters ambiguity in the data or in the request rather than just ploughing ahead. In this analysis, it found a series of physiological markers and asked which ones we were interested in. This is one of my favorite parts about our design of Studio's agentic loop and UX, and this behavior and it's implications are worthy of entire blog post.
LLM's over-eagerness to give you answer
LLMs are still predominately text-based and that behavior shows as they answer analytical questions. In Studio's agentic harness, we use vision models to "read" the graphs. However, LLMs still prefer to provide you a cold hard answer in raw data.
Plotly Studio's first (autonomous) attempt at the answer was to aggregate the exercise loads by month and then correlate that with the average physiological metrics (VO2 max, HRV, etc) in that same month across different sports.
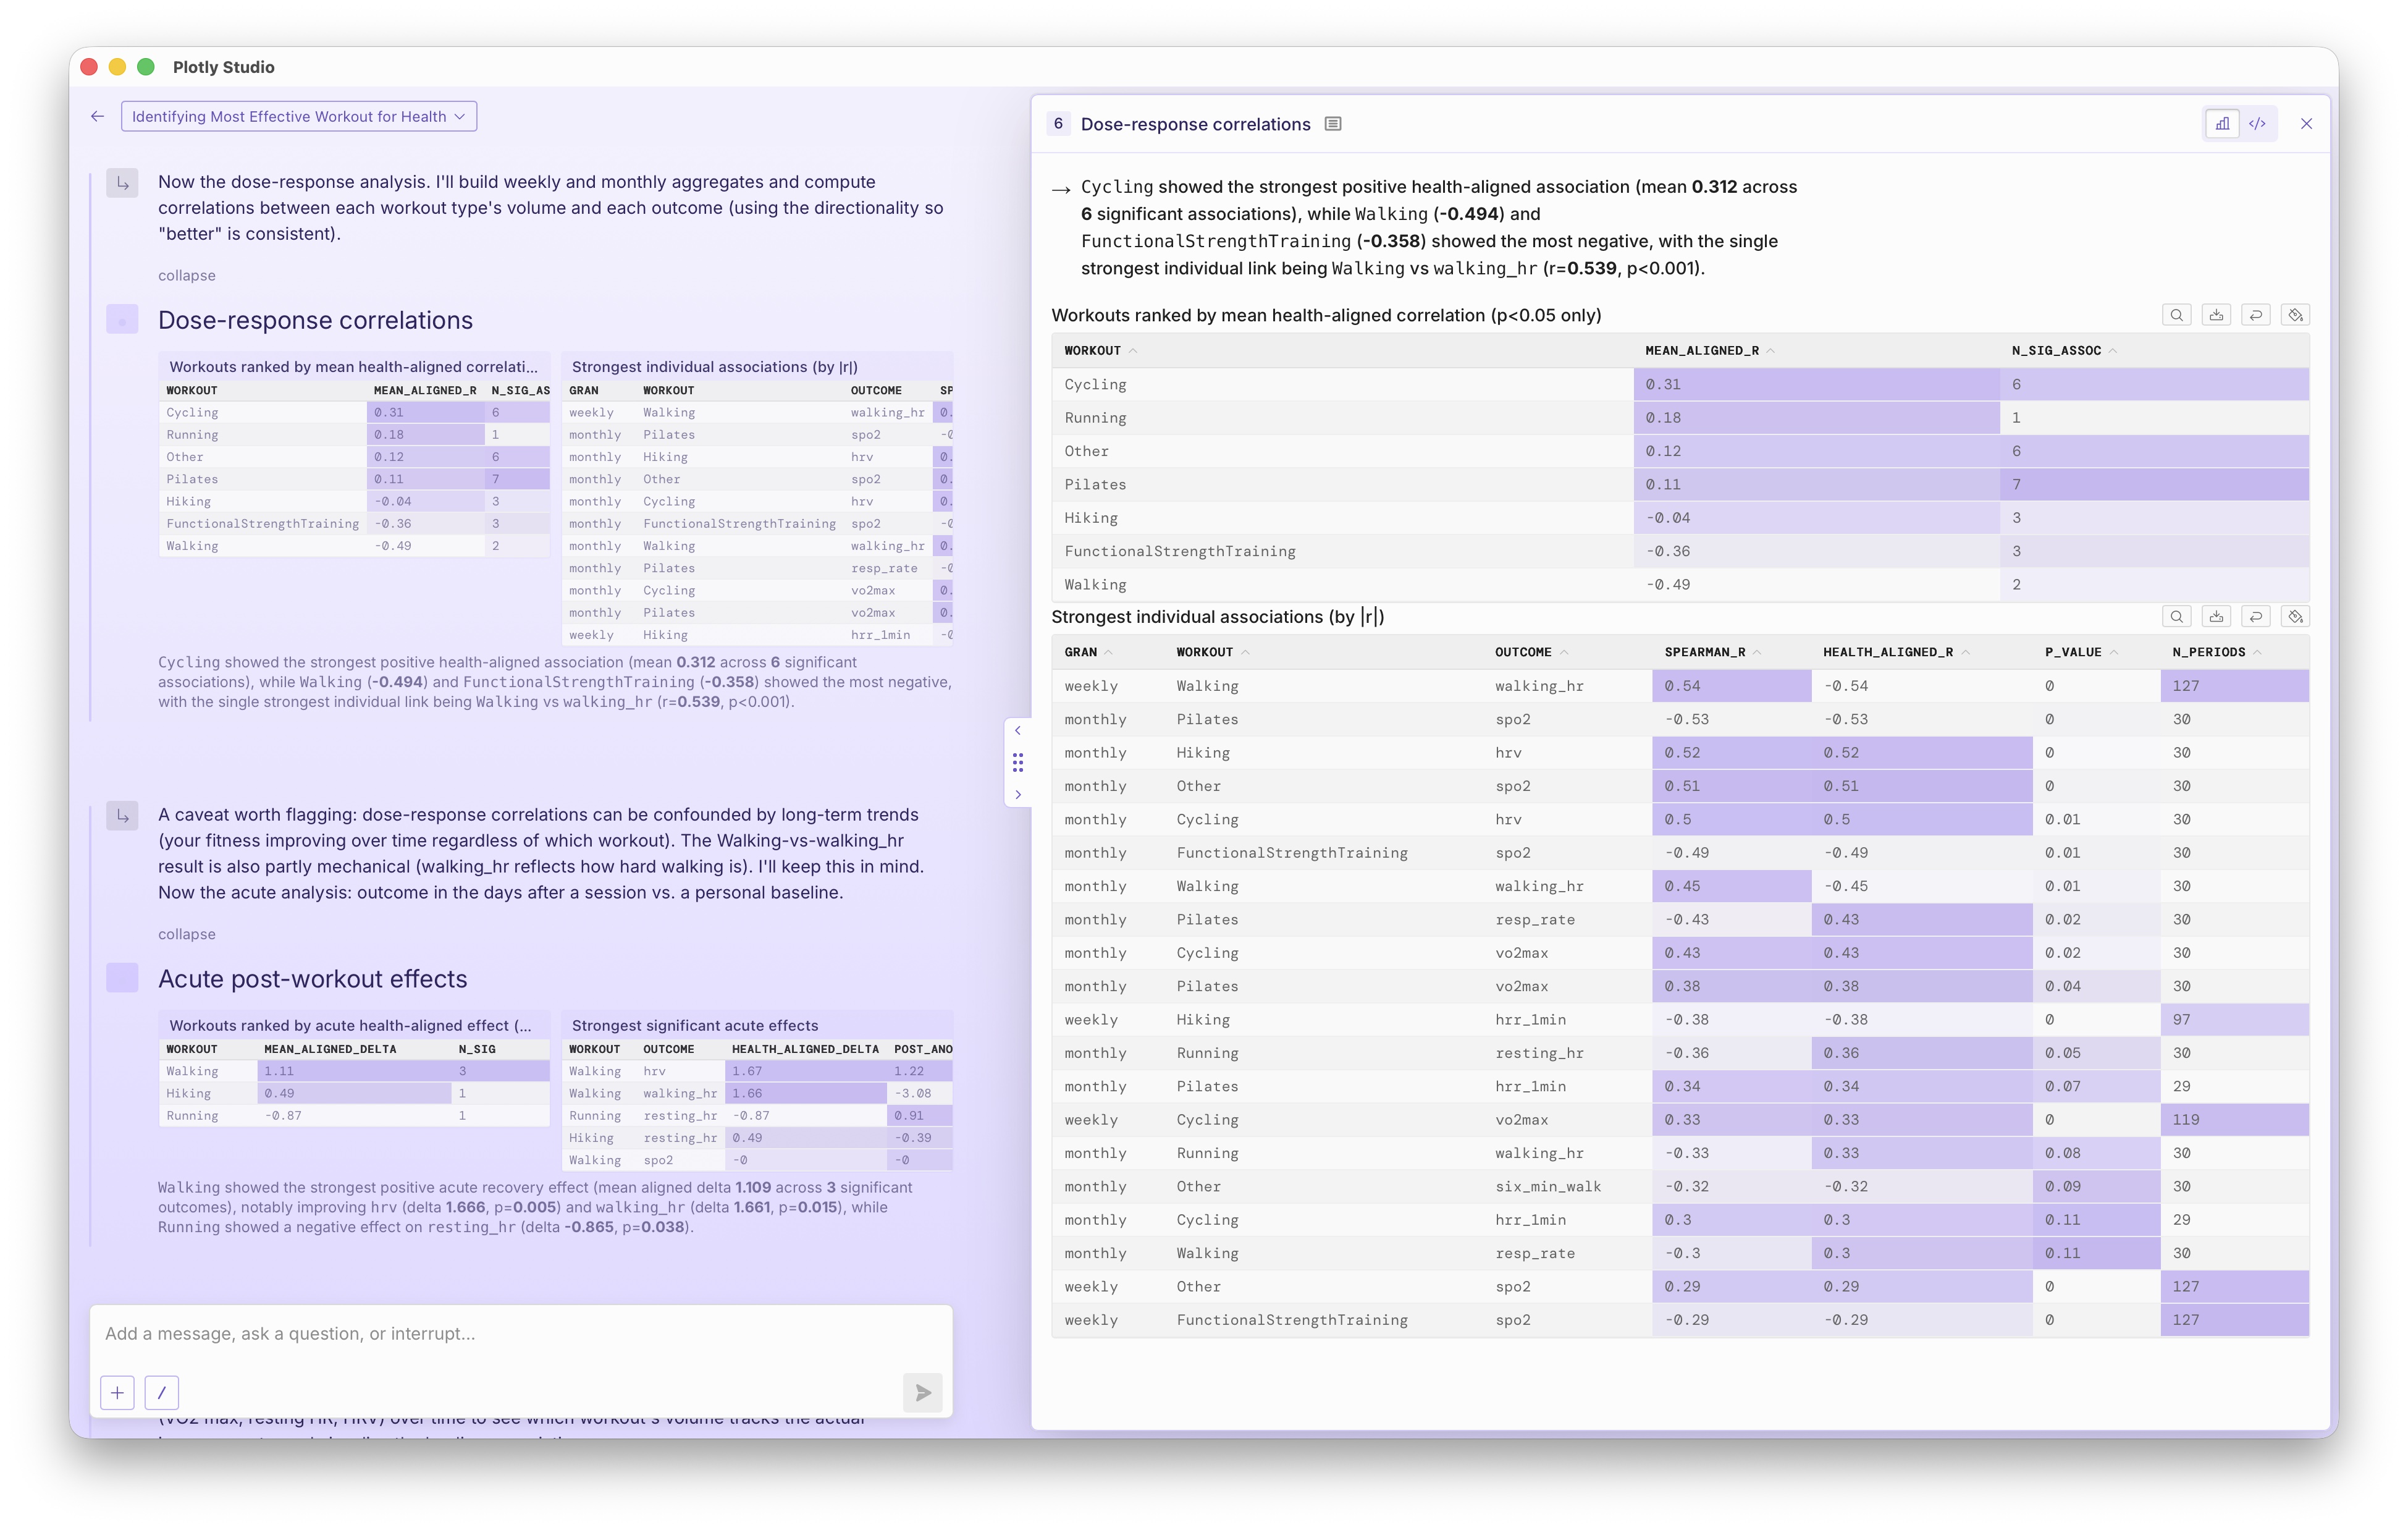
Going straight for the R and P value correlations is a pretty typical behavior of LLM's reasoning these days. They are eager to provide you a straightforward answer and finish the task at hand quickly, even when your question is relatively open ended. The behavior can feel tuned for software engineering rather than open ended reasoning and complex data analysis.
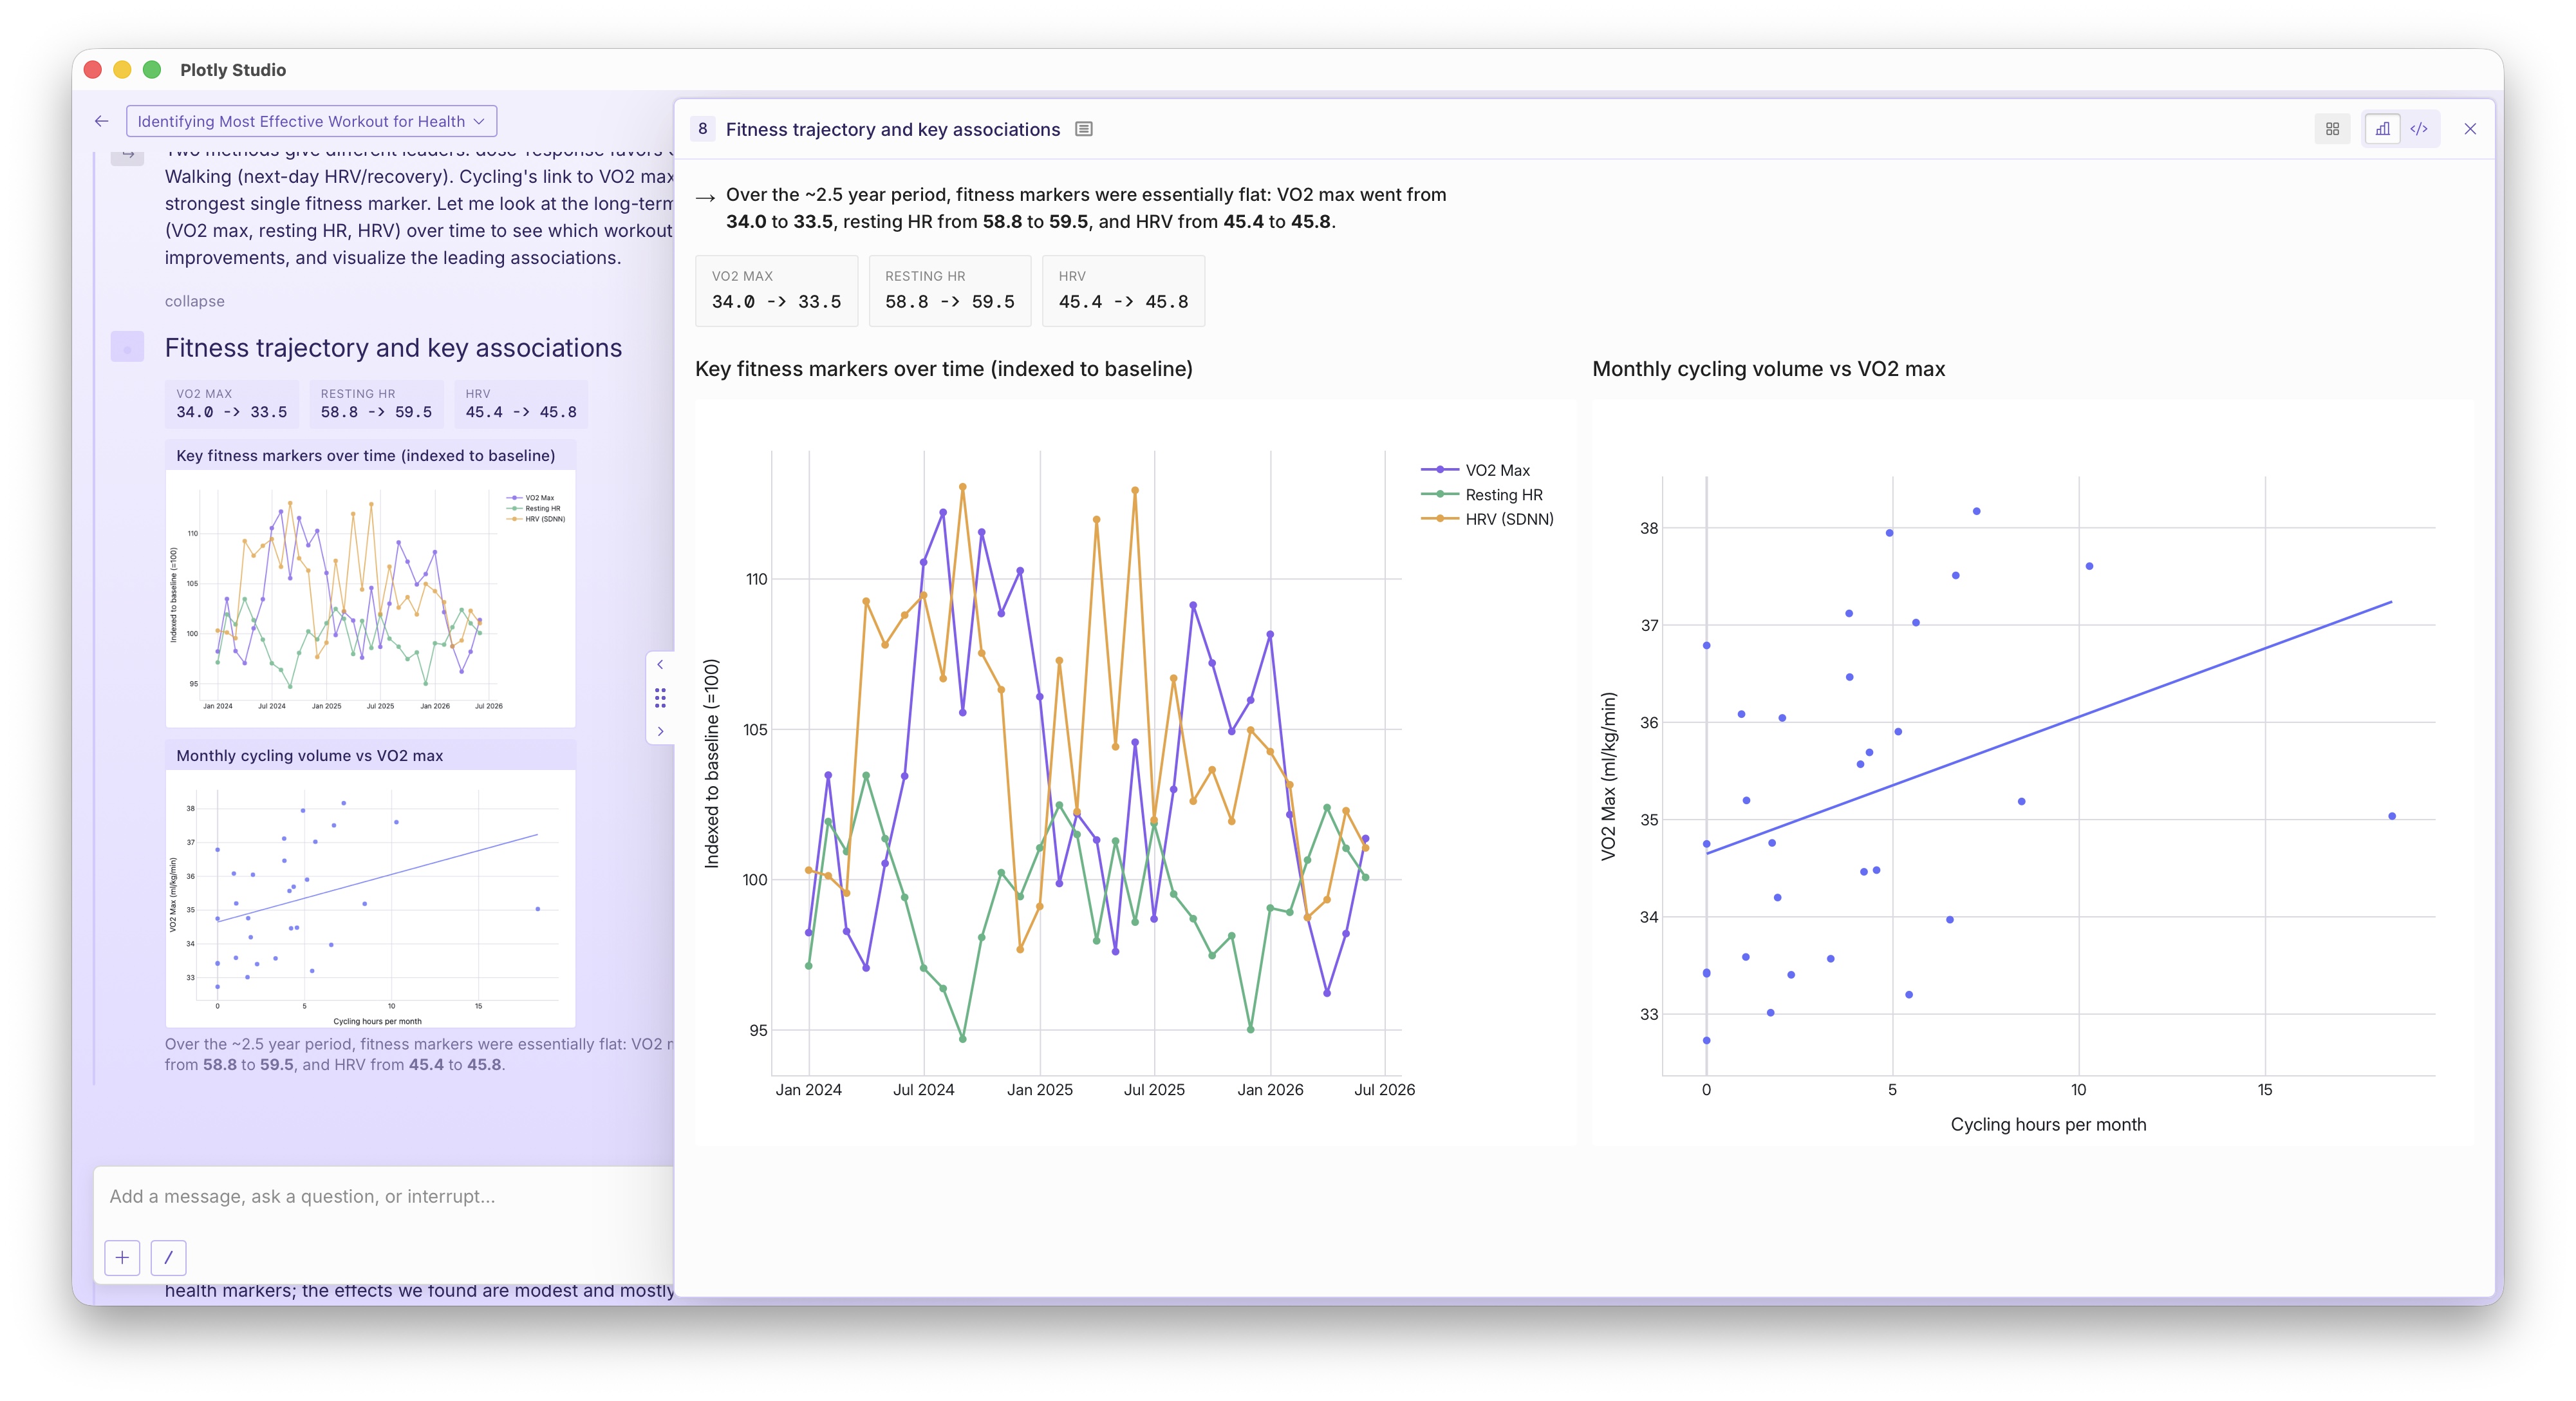
It's pretty hard to trust these correlations on their own without actually seeing the data. We've steered Studio to always show the data, here's the graph:
Exploring the data visually
Immediately I can tell that something feels off in its analysis. The line chart is pretty chaotic, and I would expect to see some more detailed trends. At this point, we decided to zoom out and look at the raw data in a bit more detail to better understand the data and see if we can feel out some patterns rather than immediately compute the patterns.
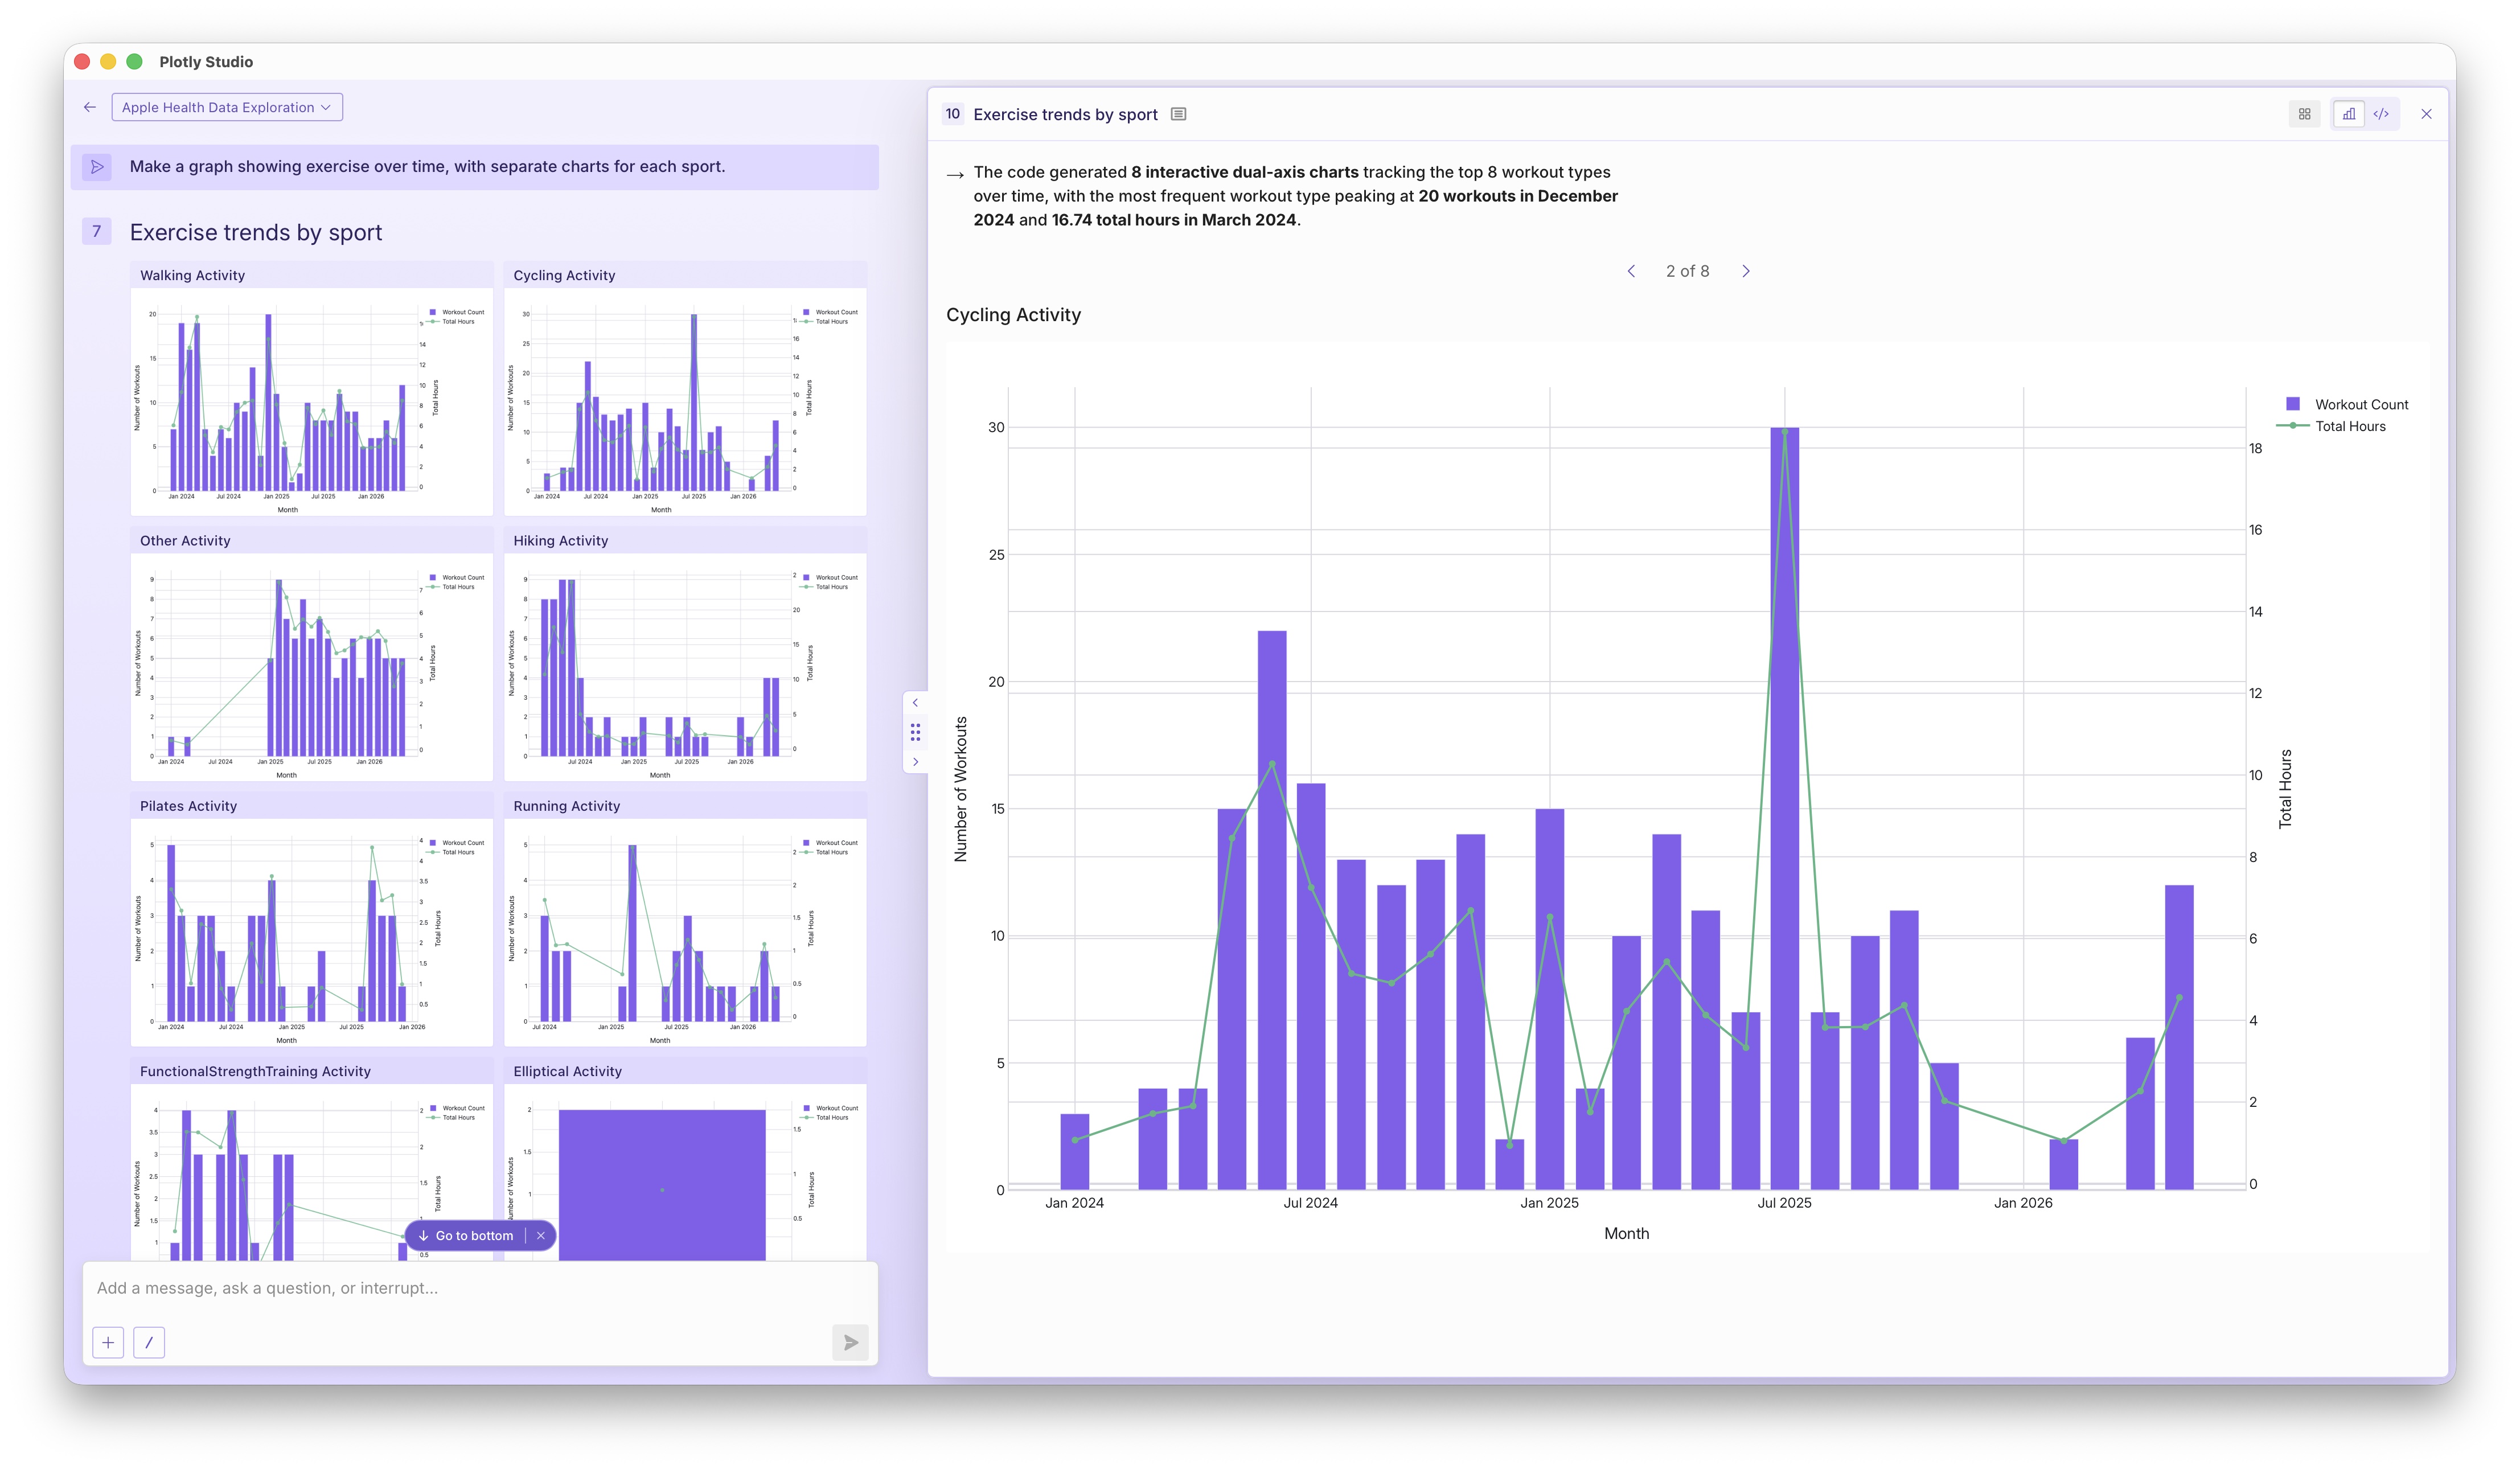
Prompt: Make a graph showing exercise over time, with separate charts for each sport.
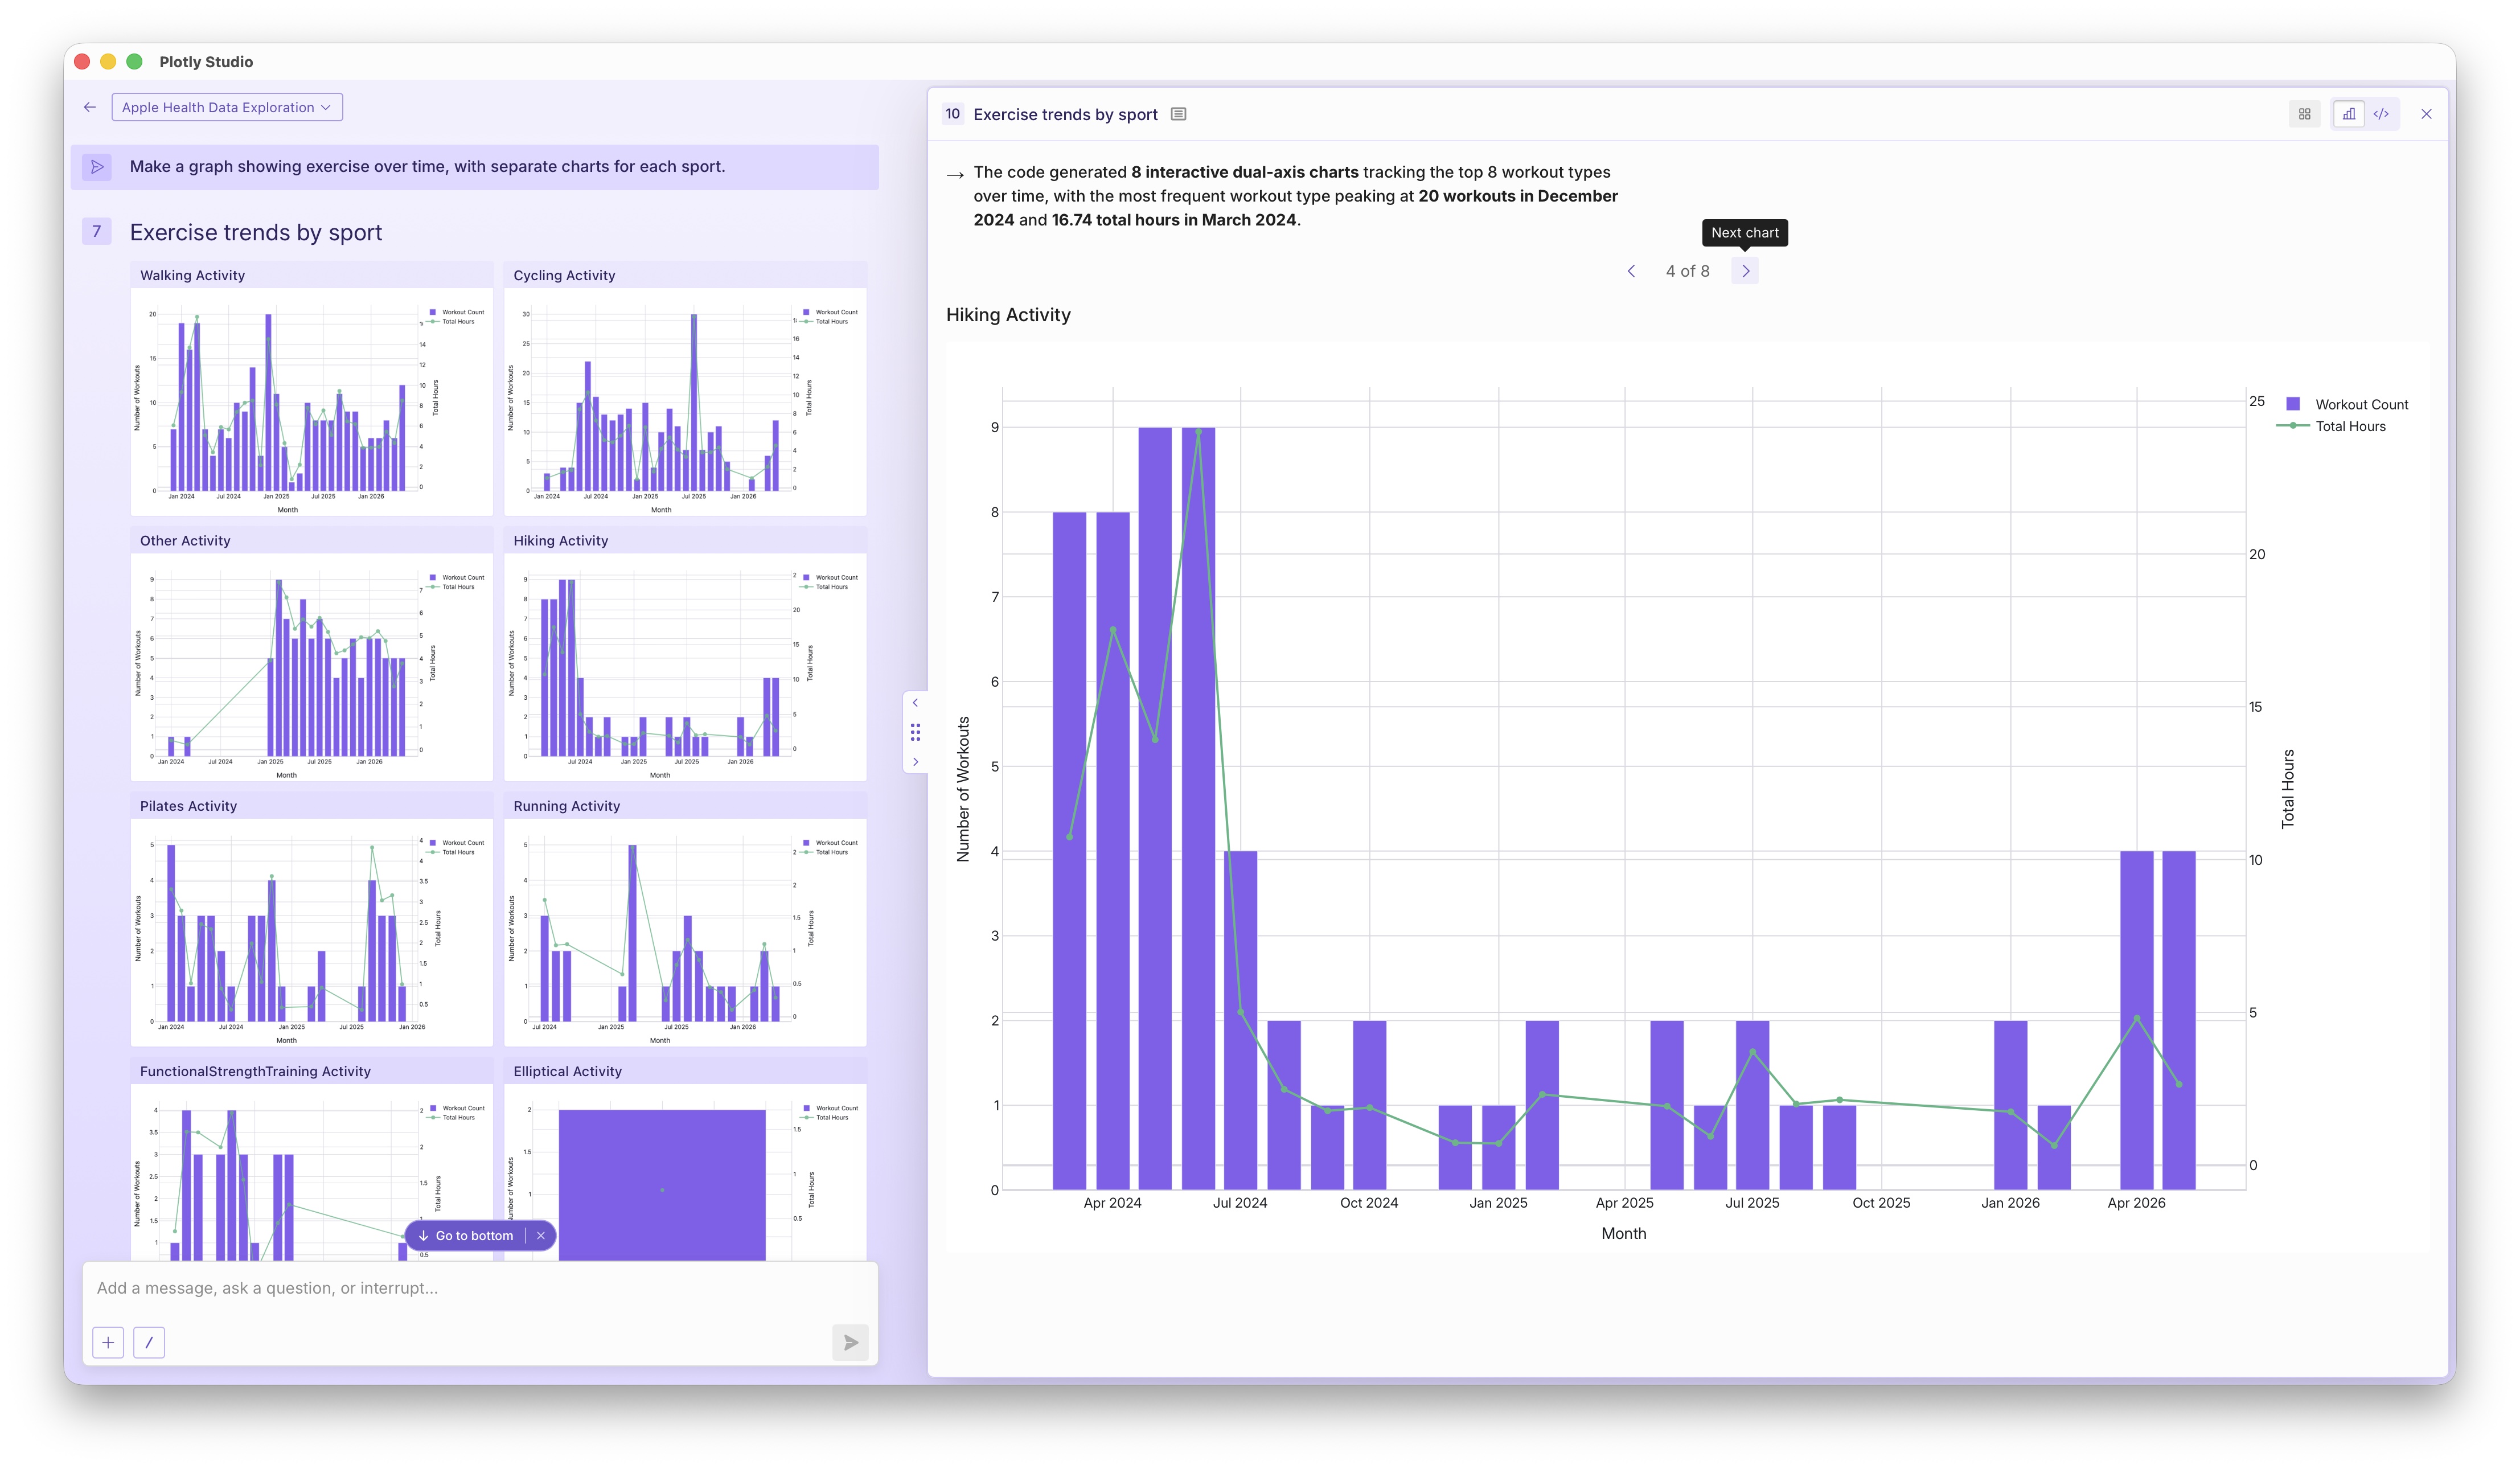
Plotly Studio generates several charts in a single step, with a carousel to click through each chart one by one. It's quite remarkable how much it can generate in a single step. And we can start to see that there were different time periods that were dominated by different sports. It starts to feel like we could maybe see some cause-and-effect relationships between her period of intense hiking training vs her period of cycling-to-work every day.
Getting particular about the visuals
I've become pretty particular how I like to look at time series.
- Aggregations by day/week/month: So summing up the number of workouts or minutes spent in each workout over the entire week and displaying this as a bar
- Rolling aggregations over a longer time period with a center-aligned sum: So summing up all of the workouts in the previous 15 days and the next 15 days as a line.
- Stacked subplots - Displaying metrics in a single plot with a shared x-axis and separate y-axes for different scales.
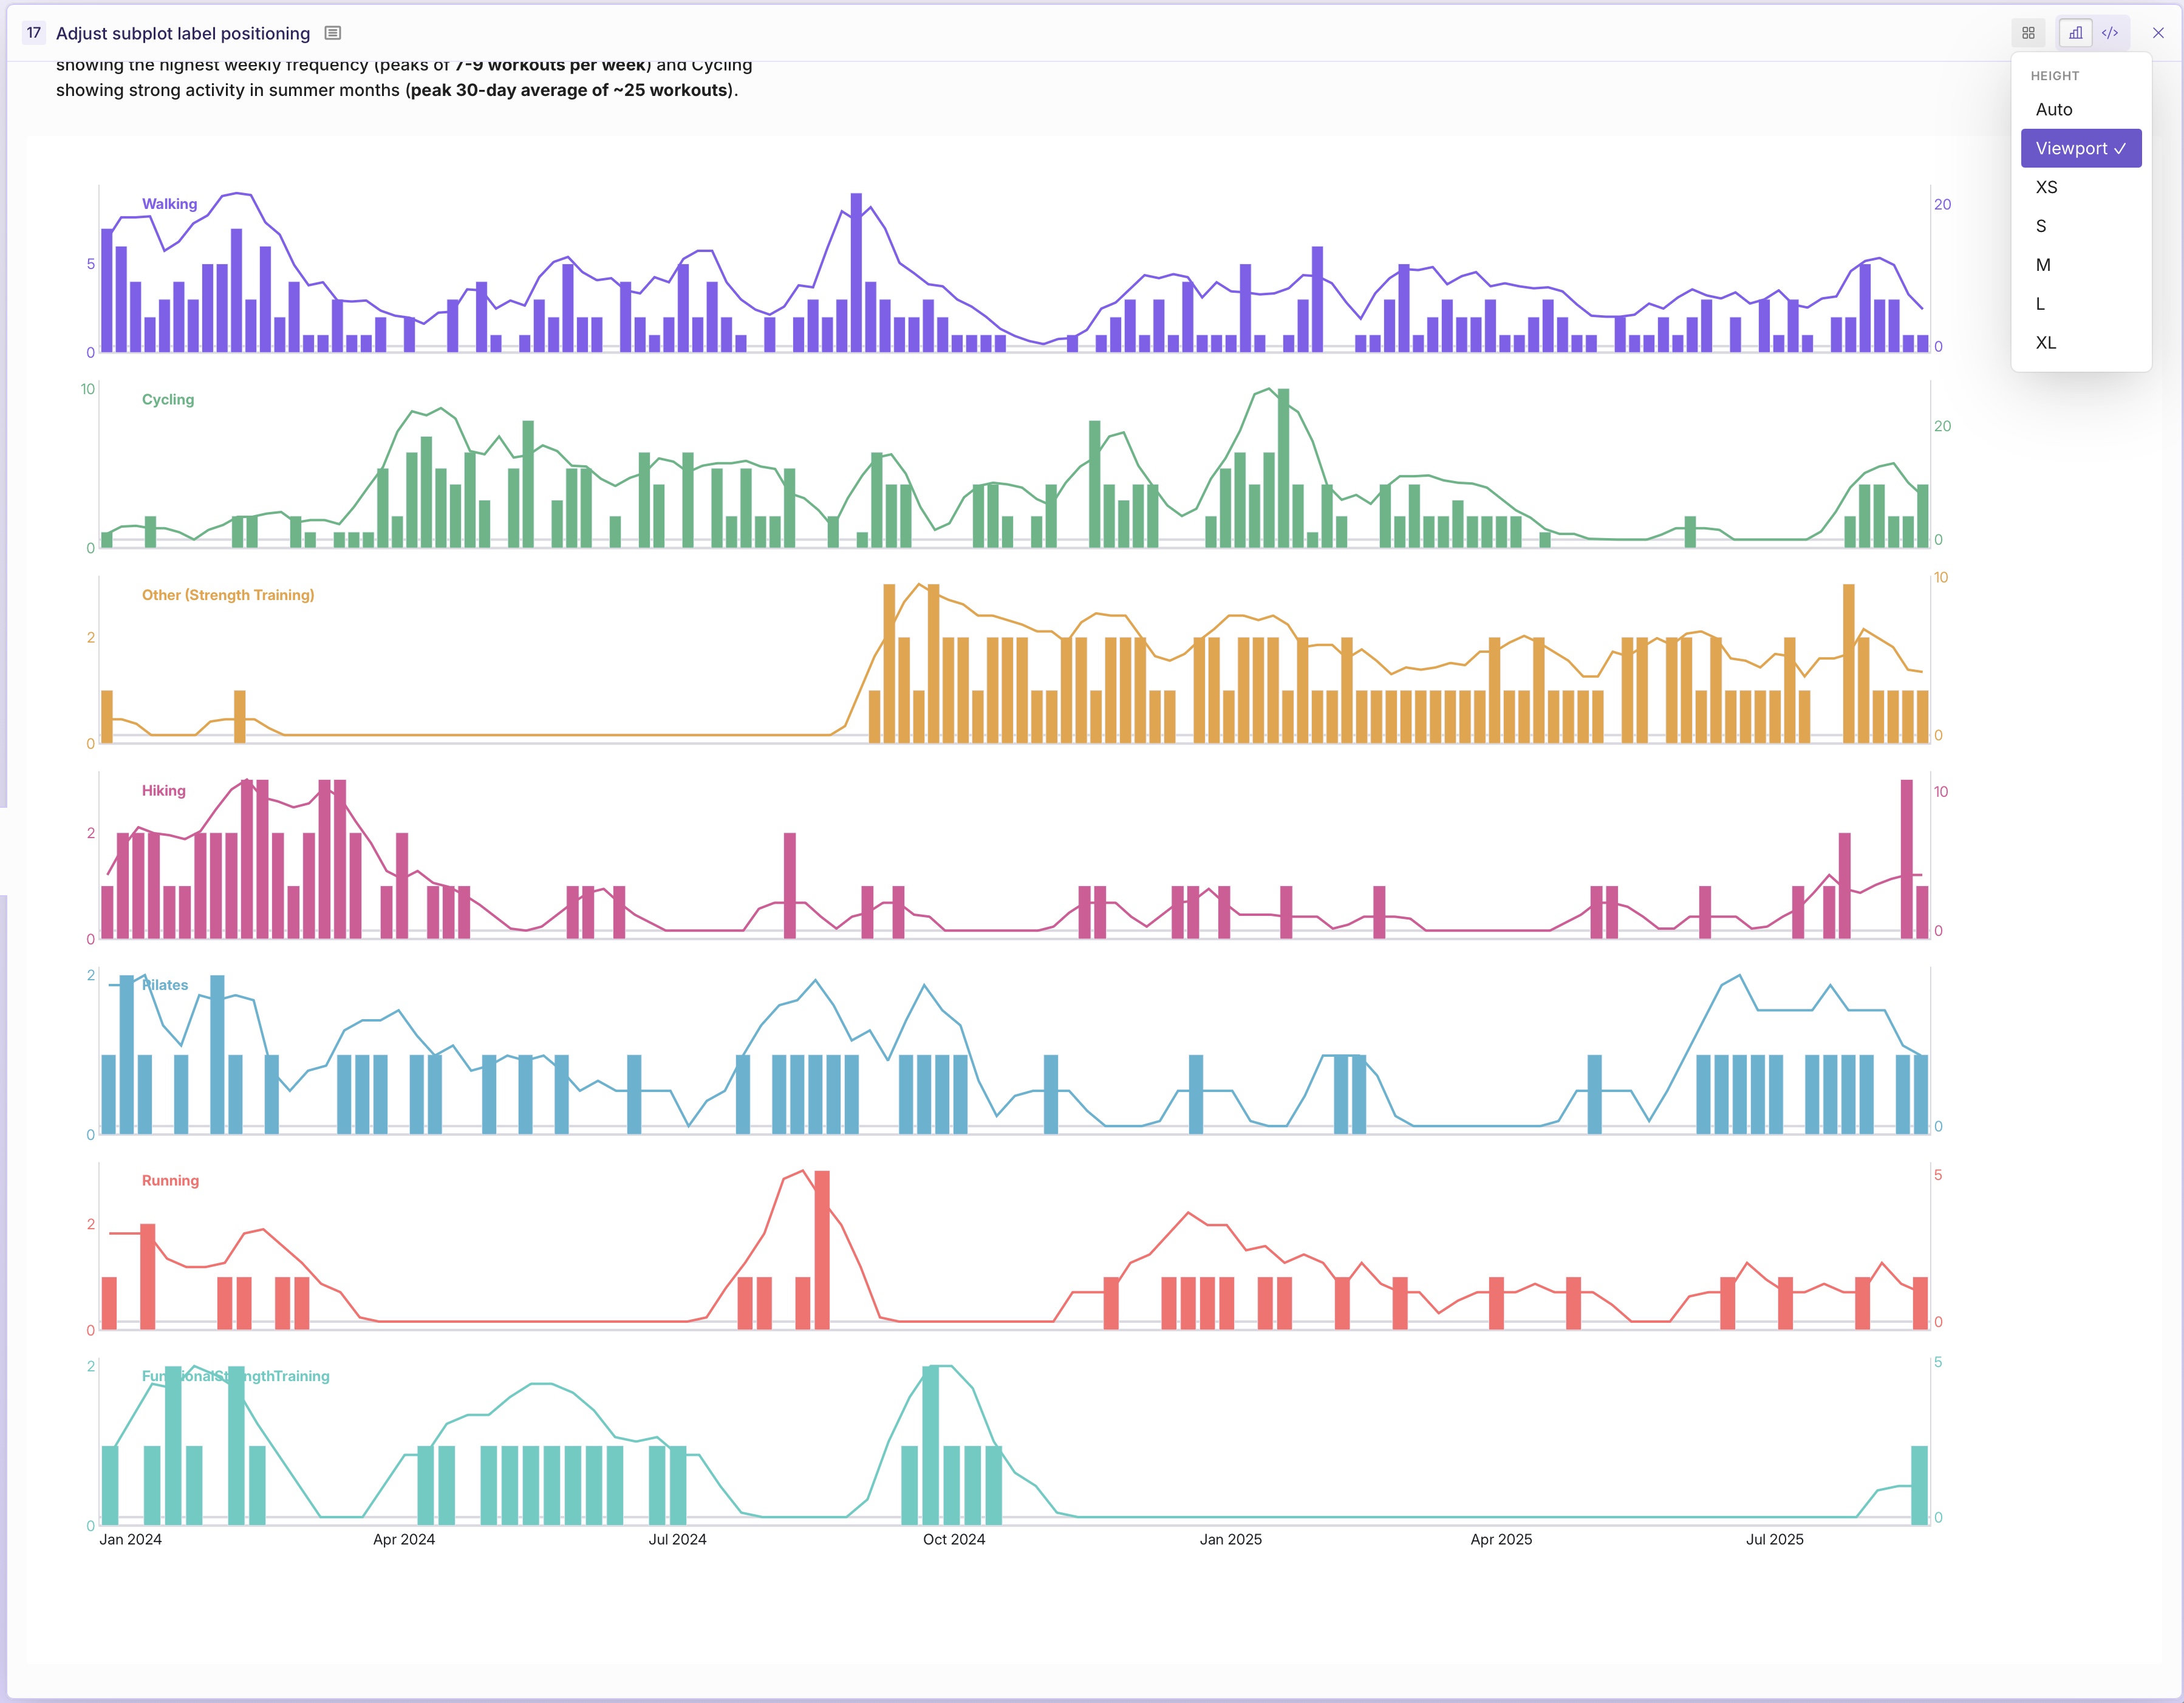
I'll iterate on the visuals a lot when I work in Plotly Studio, here's the prompt I ended up with:
Prompt: Show each workout type as stacked subplots.
The workout type "Other" should be labeled as "Other (Strength Training)"Sum up the total number of workouts by week and display them as bars and then show a rolling 30 day window (center-computed) of the total number of workouts. Display the line as a right-hand-side y-axis.
Do this for each workout type. Have the charts share an x-axis. Build the charts using plotly's graph objects instead of `make_subplots` for full control. Do a different color for each exercise type but do the same color for the lines and bars within a subplot.Only display y-axes labels on the top subplot. And only display x-axis labels (year/month) on the bottom xaxis. Don't display grid lines and only display 2 tick marks. Display the title of each subplot in the same color as the bars and lines in the top left corner of each subplot.
Putting it all together and the data comes to life:
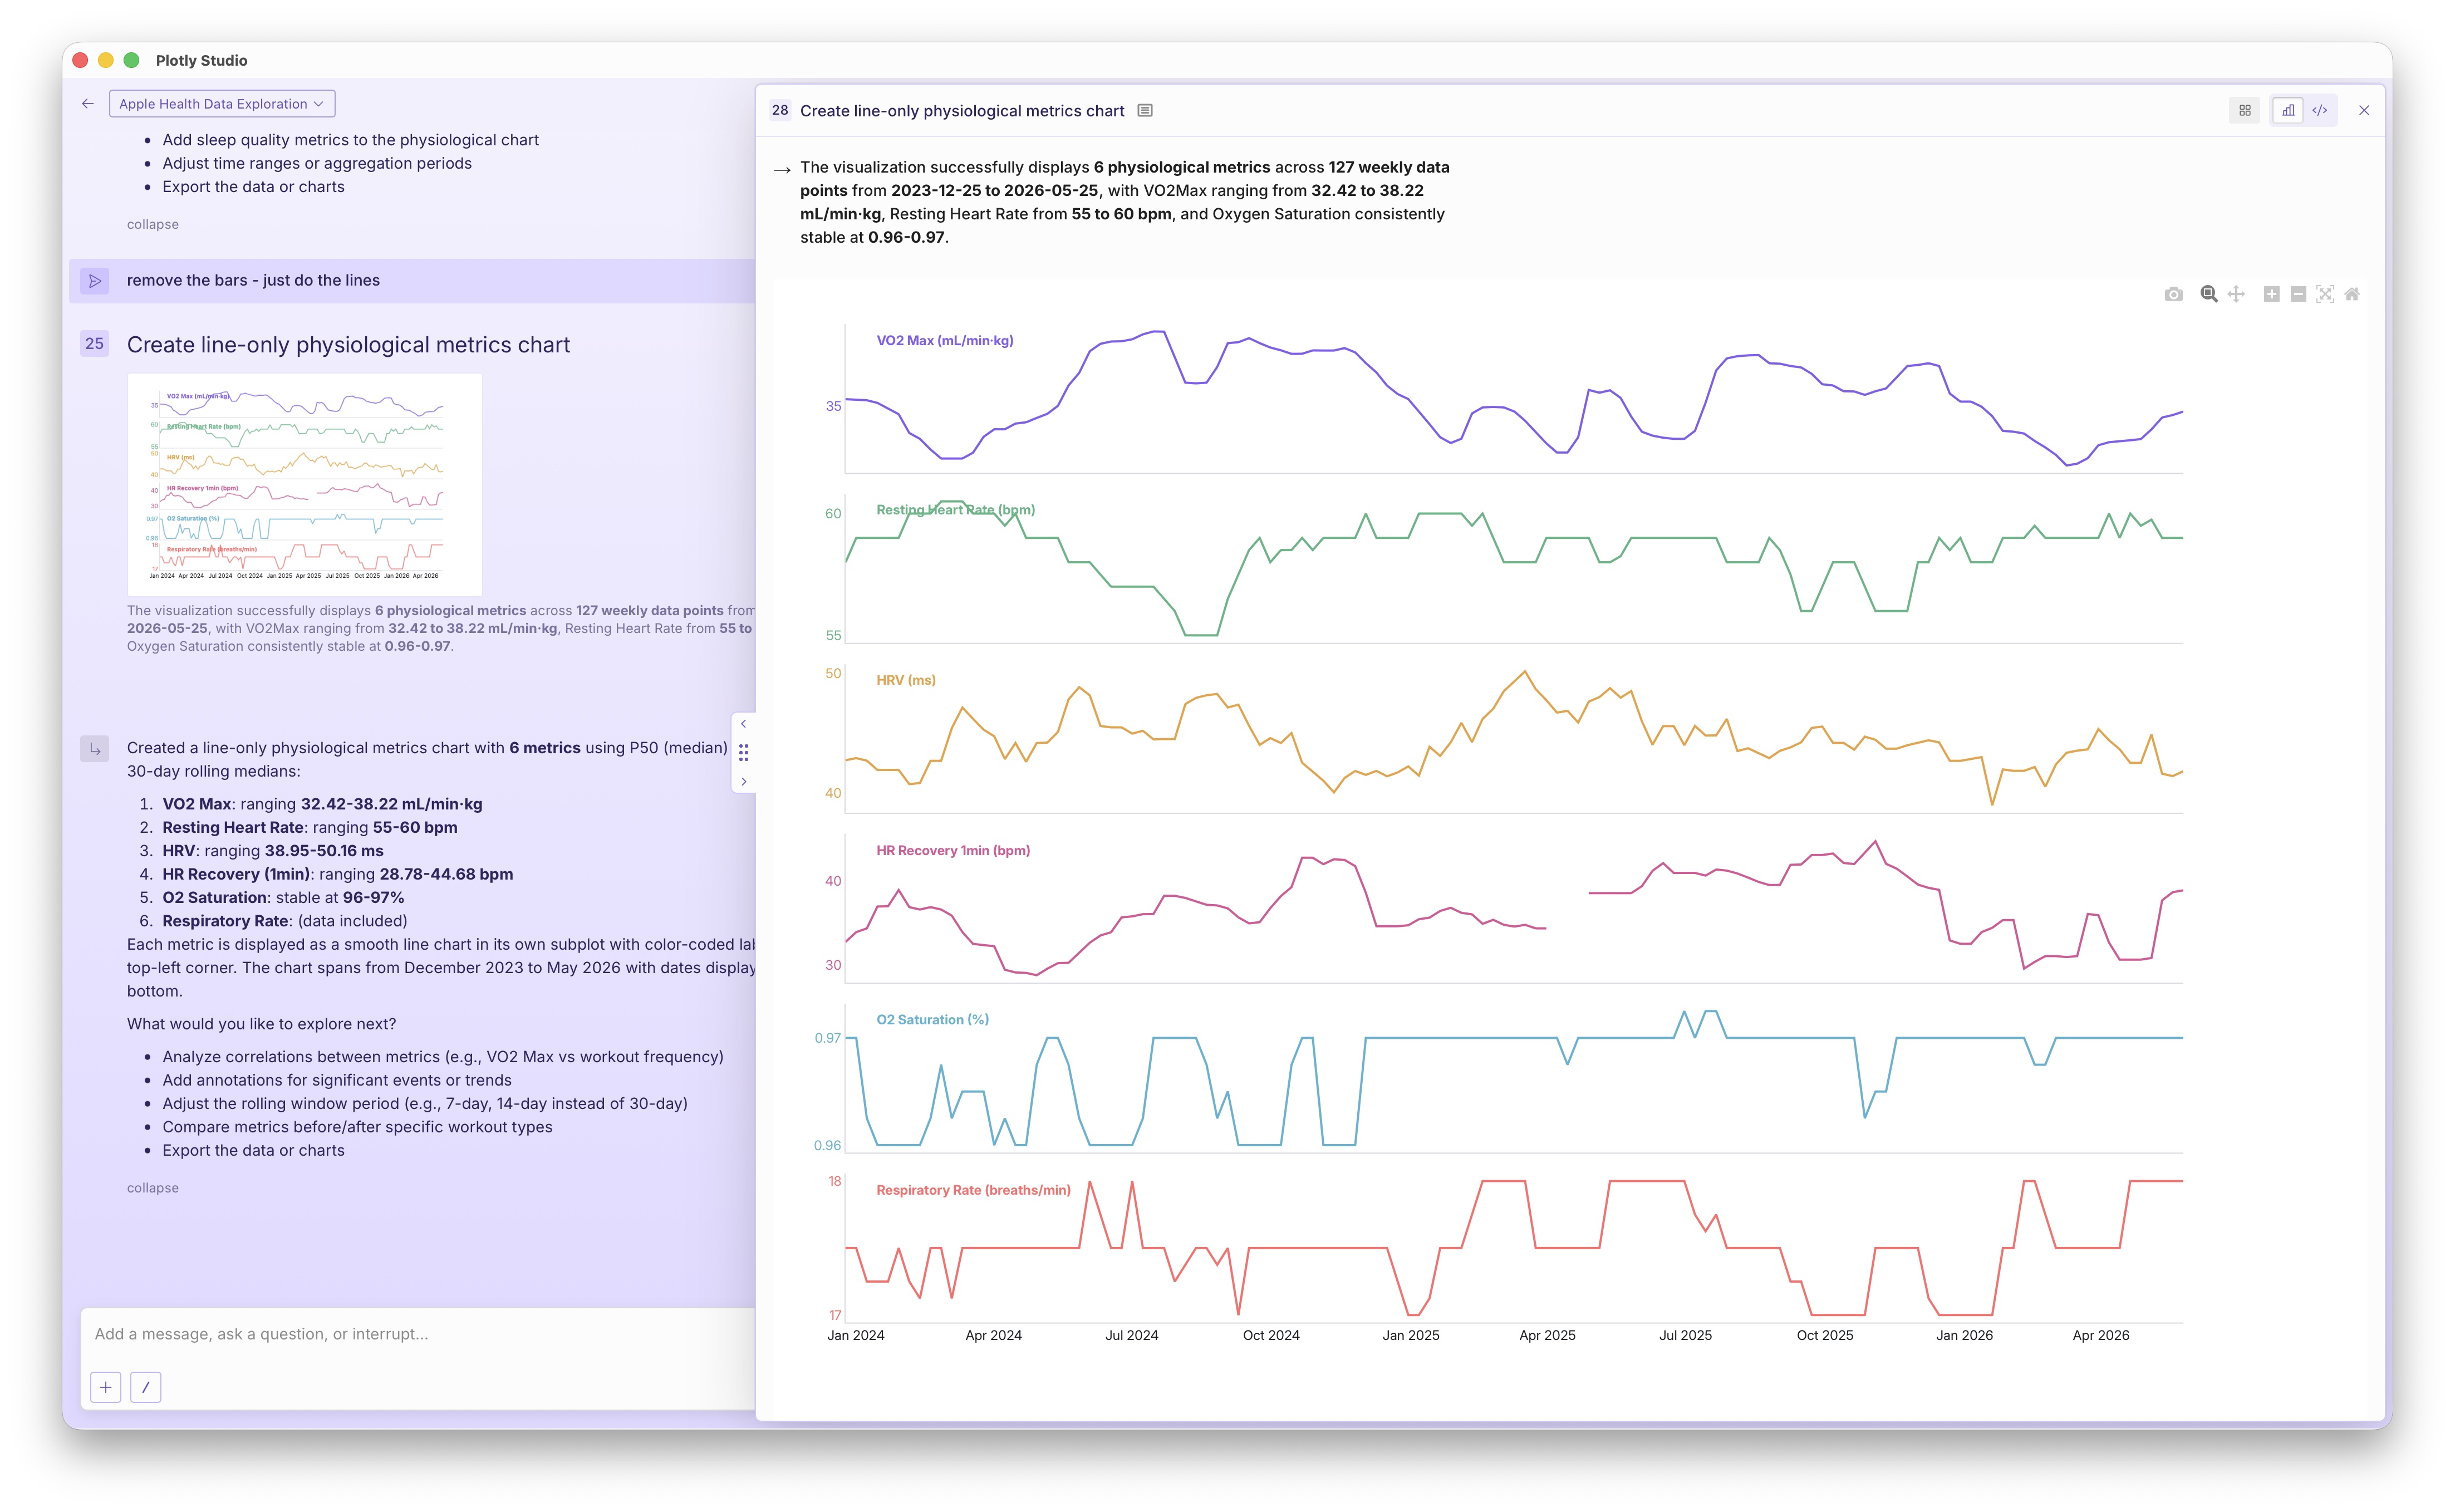
And then similarly for physiology metrics.
Prompt: Create similar subplots as above but instead of splitting by exercise metrics, split it out by physiological metrics: VO2 Max, Heart Rate Variability (HRV), Resting Heart Rate (RHR), Sleep Quality, and more. And instead of summing the numbers do a median (P50) and only display the lines (no bars).
Seeing patterns of VO2 Max and HRV
When you put those two charts together, you get our original mother-of-all charts that we showed at the top.
Prompt: Update the exercise subplots to display a different physiological metric (P50 over 30 day moving window) as a thin black line with it's own 3rd y-axis on the right and as its own subplot on the top (just the line).
The remarkable efficacy of visual pattern recognition
In the era of agentic data analytics, I've sometimes been asked: what's the purpose of data visualization if the agents can crunch numbers without it?
This analysis is a case study showing the limitations in purely number-based analytics reasoning. Computing correlations in time series is pretty difficult with statistics alone - cause and effect is often delayed and operates on its own periodicity and under varying regions of time. It's easy to come to the wrong conclusion, and difficult to trust unless you see the data.
But the patterns become remarkably clear once you graph it the right way.
So for complex analyses like these, our existing AI models and agentic harnesses don't quite have it nailed yet. I suspect that we'll need to introduce more visualization in the agentic loop as part of the reasoning loop (using vision models to interpret charts) rather than doing visualization just for human-interpretability.
Augmentation or Agents
The great debate in AI today is whether AI will be primarily used as a way to augment our work (productivity tools) or as a way to do work on its own (self-running agents).
AI is a jagged frontier. For this analysis, AI shined as an augmentation tool. In other types of data analysis, we'll see that it can work reliably as a self-running agent. Understanding this jagged frontier of capability is an active area that we're exploring in as we build out the agentic analytics in Plotly Studio. Doing a deep dive on examples like these really help break it down from the abstract benchmarks to real world, curious explorations.