
Designing a Benchmark Suite for the Agentic Analytics Era - Part 1
We've been refreshing our benchmarks in Plotly Studio.
The benchmarks measure how good Plotly Studio - and any agentic system - is at data analytics and visualization. It's a series of prompts with known solutions and expected behaviors.
The industry has many benchmarks for software development (Terminal-Bench 2.0, SWE-bench Pro, etc) and less for data analysis. The prevailing opinion is that models are benchmaxxxed - tuned to pass the benchmark - and should be taken with a grain of salt. And more recently, it's been reported that about 40% of the results on these benchmarks are false positives.
So I think it's important to get to know your benchmarks, especially in the products that you use.
Designing a benchmark is an exercise is envisioning how you want your system to work - what should it be good at, what might be hard for it to do, what should it's behavior be in the face of difficulty or ambiguity, and what isn't easily measured?
It's a set of challenges that we get to know intimately as the designers and makers of the agentic system.
Here's a look behind the scenes in the next generation of our benchmarks:
Answering the (Unambiguous) Question
This is the obvious case that we start with. Can the analytics agent answer the query? We provide a complex dataset, ask an unambiguous question, and check the session if the unambiguous answer was provided.
A couple of examples:
Prompt: "How many defective items are there?"
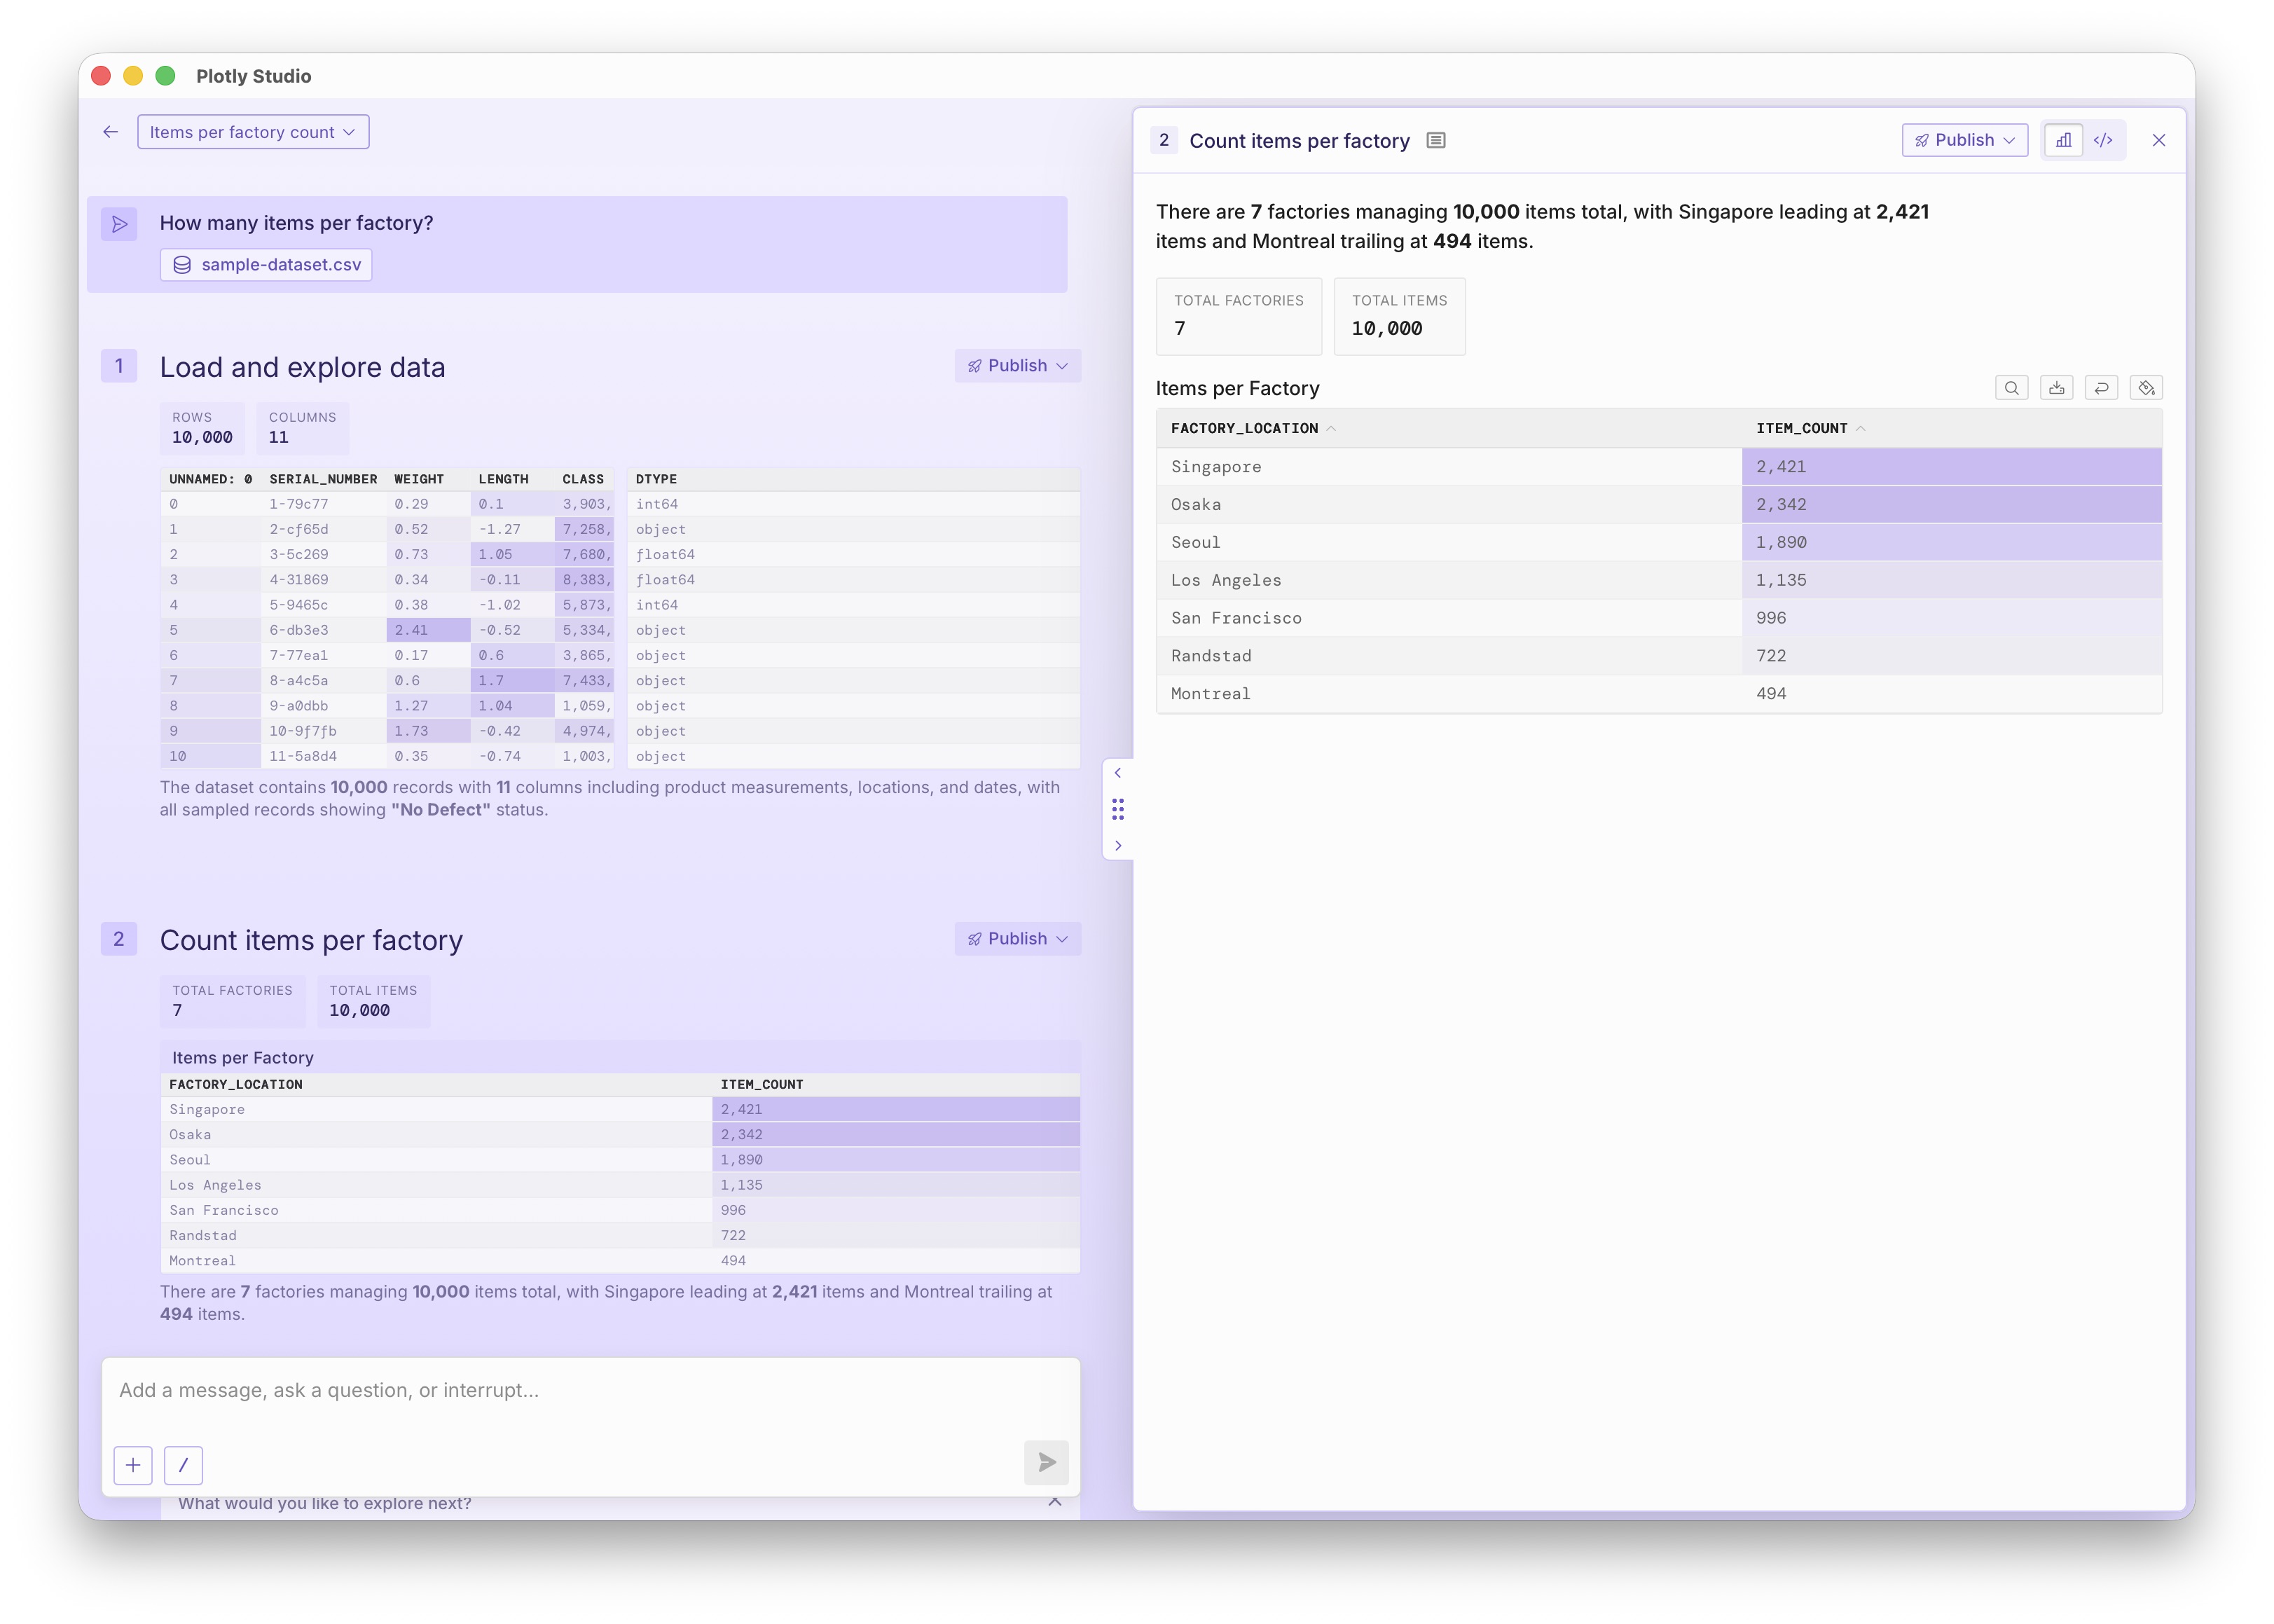
It gets more interesting when the analysis can't be answered in a single step; where one step's answer leads into the next step's analytics.
Prompt: "Do heavier items have more or fewer defects? Calculate the average weight of defective vs non-defective items and determine if there's a meaningful difference."
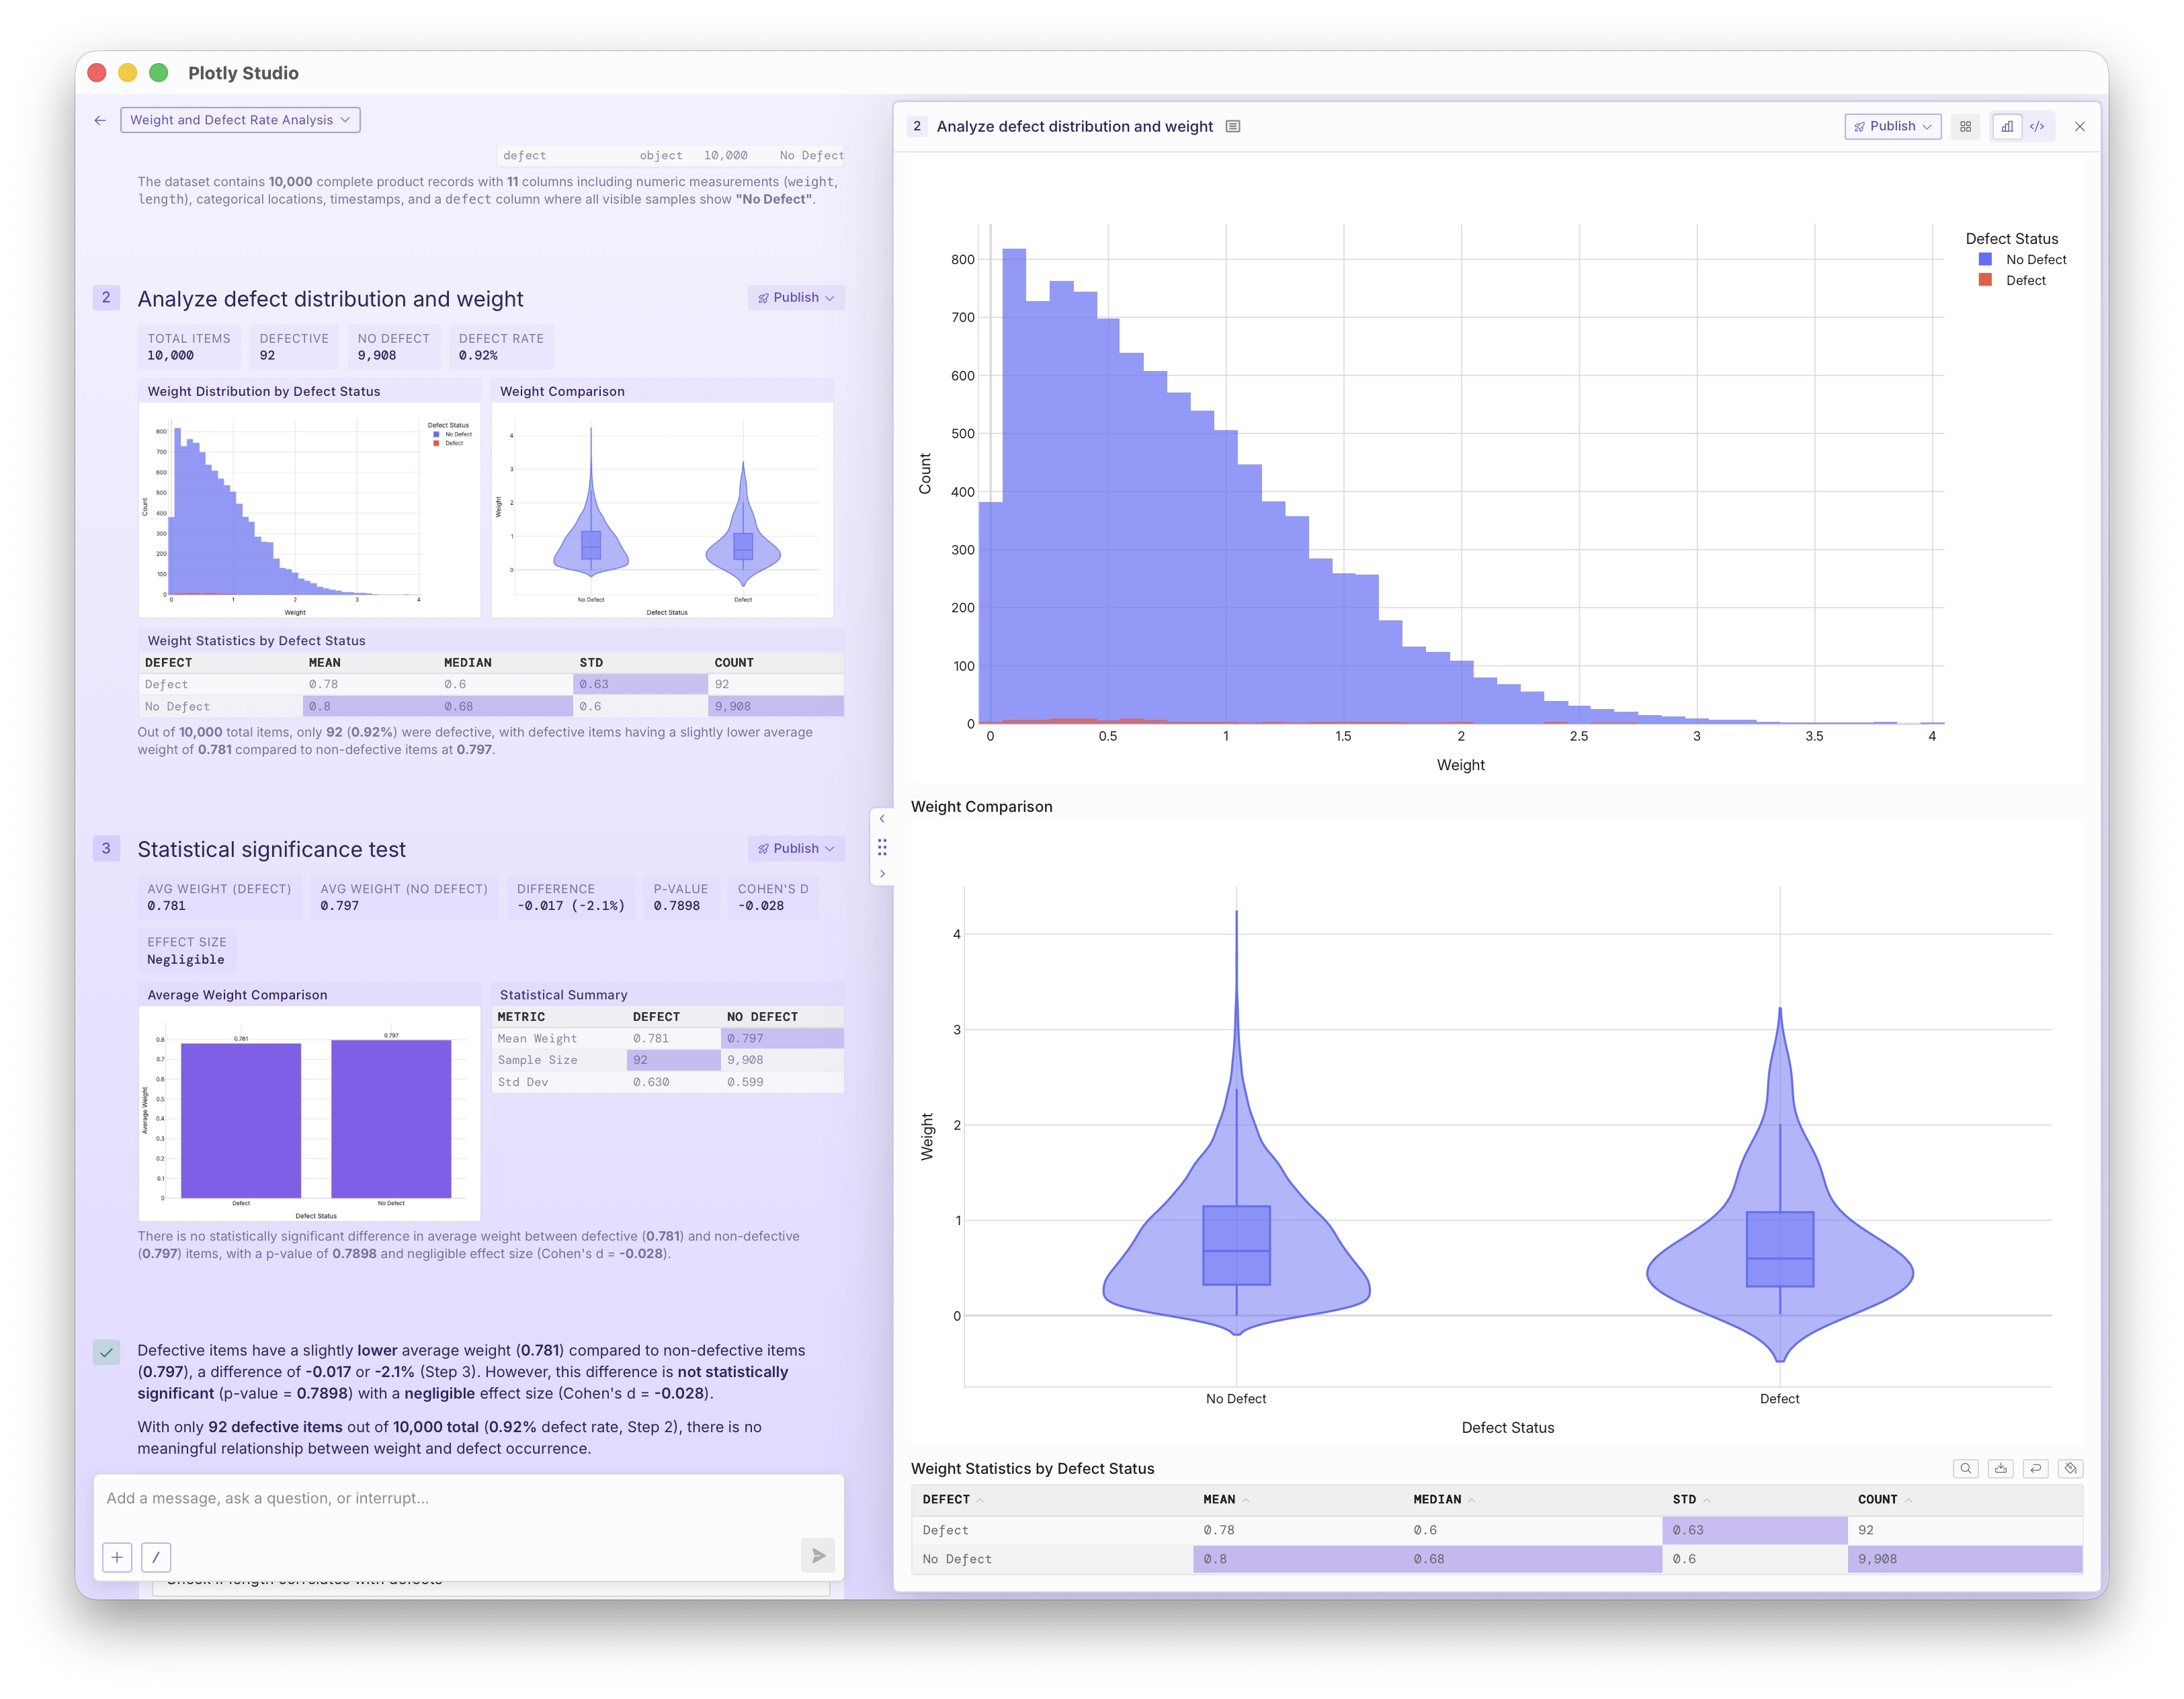
Frontier LLMs running within Studio's harness have almost no problem with this class of problem.
Schema Discovery
Note that we're not providing any information about the dataset. We're
measuring the product on how well it can discover the dataset and the
dataset's schema.
So these requests can't be one-shotted. The first few steps of the analysis will always be to explore the tables.
Our benchmarks include databases with 100s of columns across many tables.
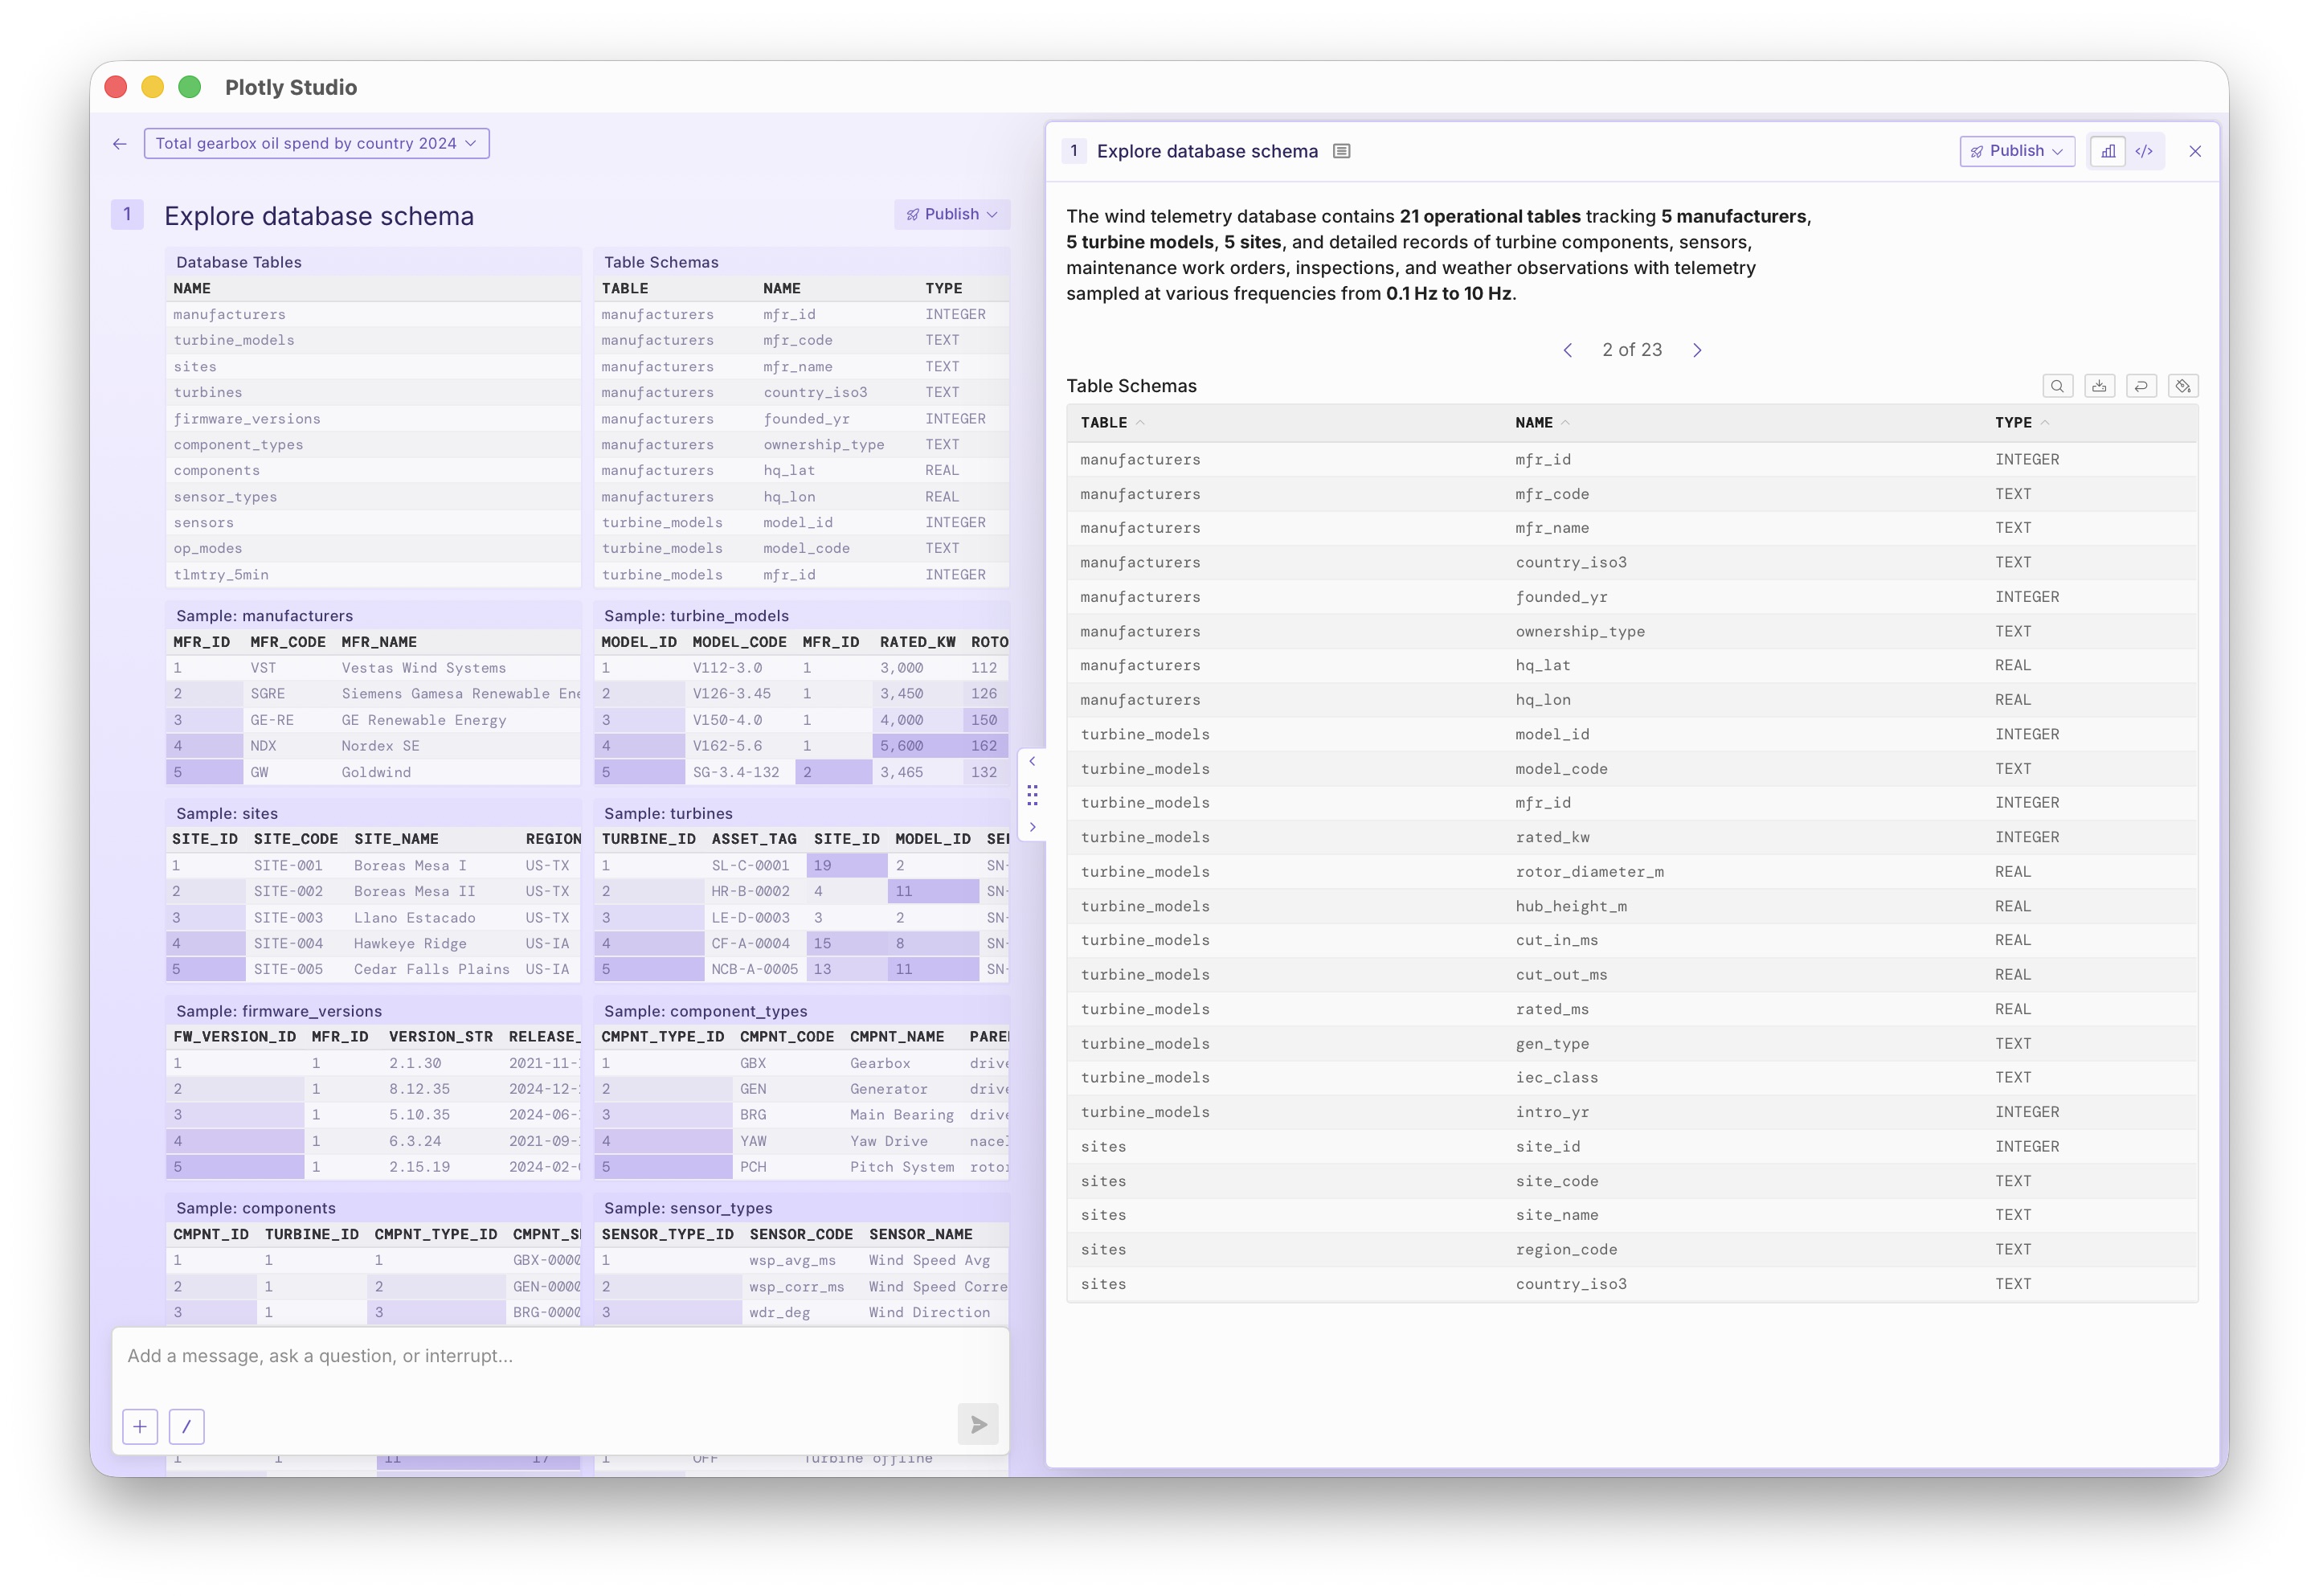
Prompt: "Find gearbox oil spend data":
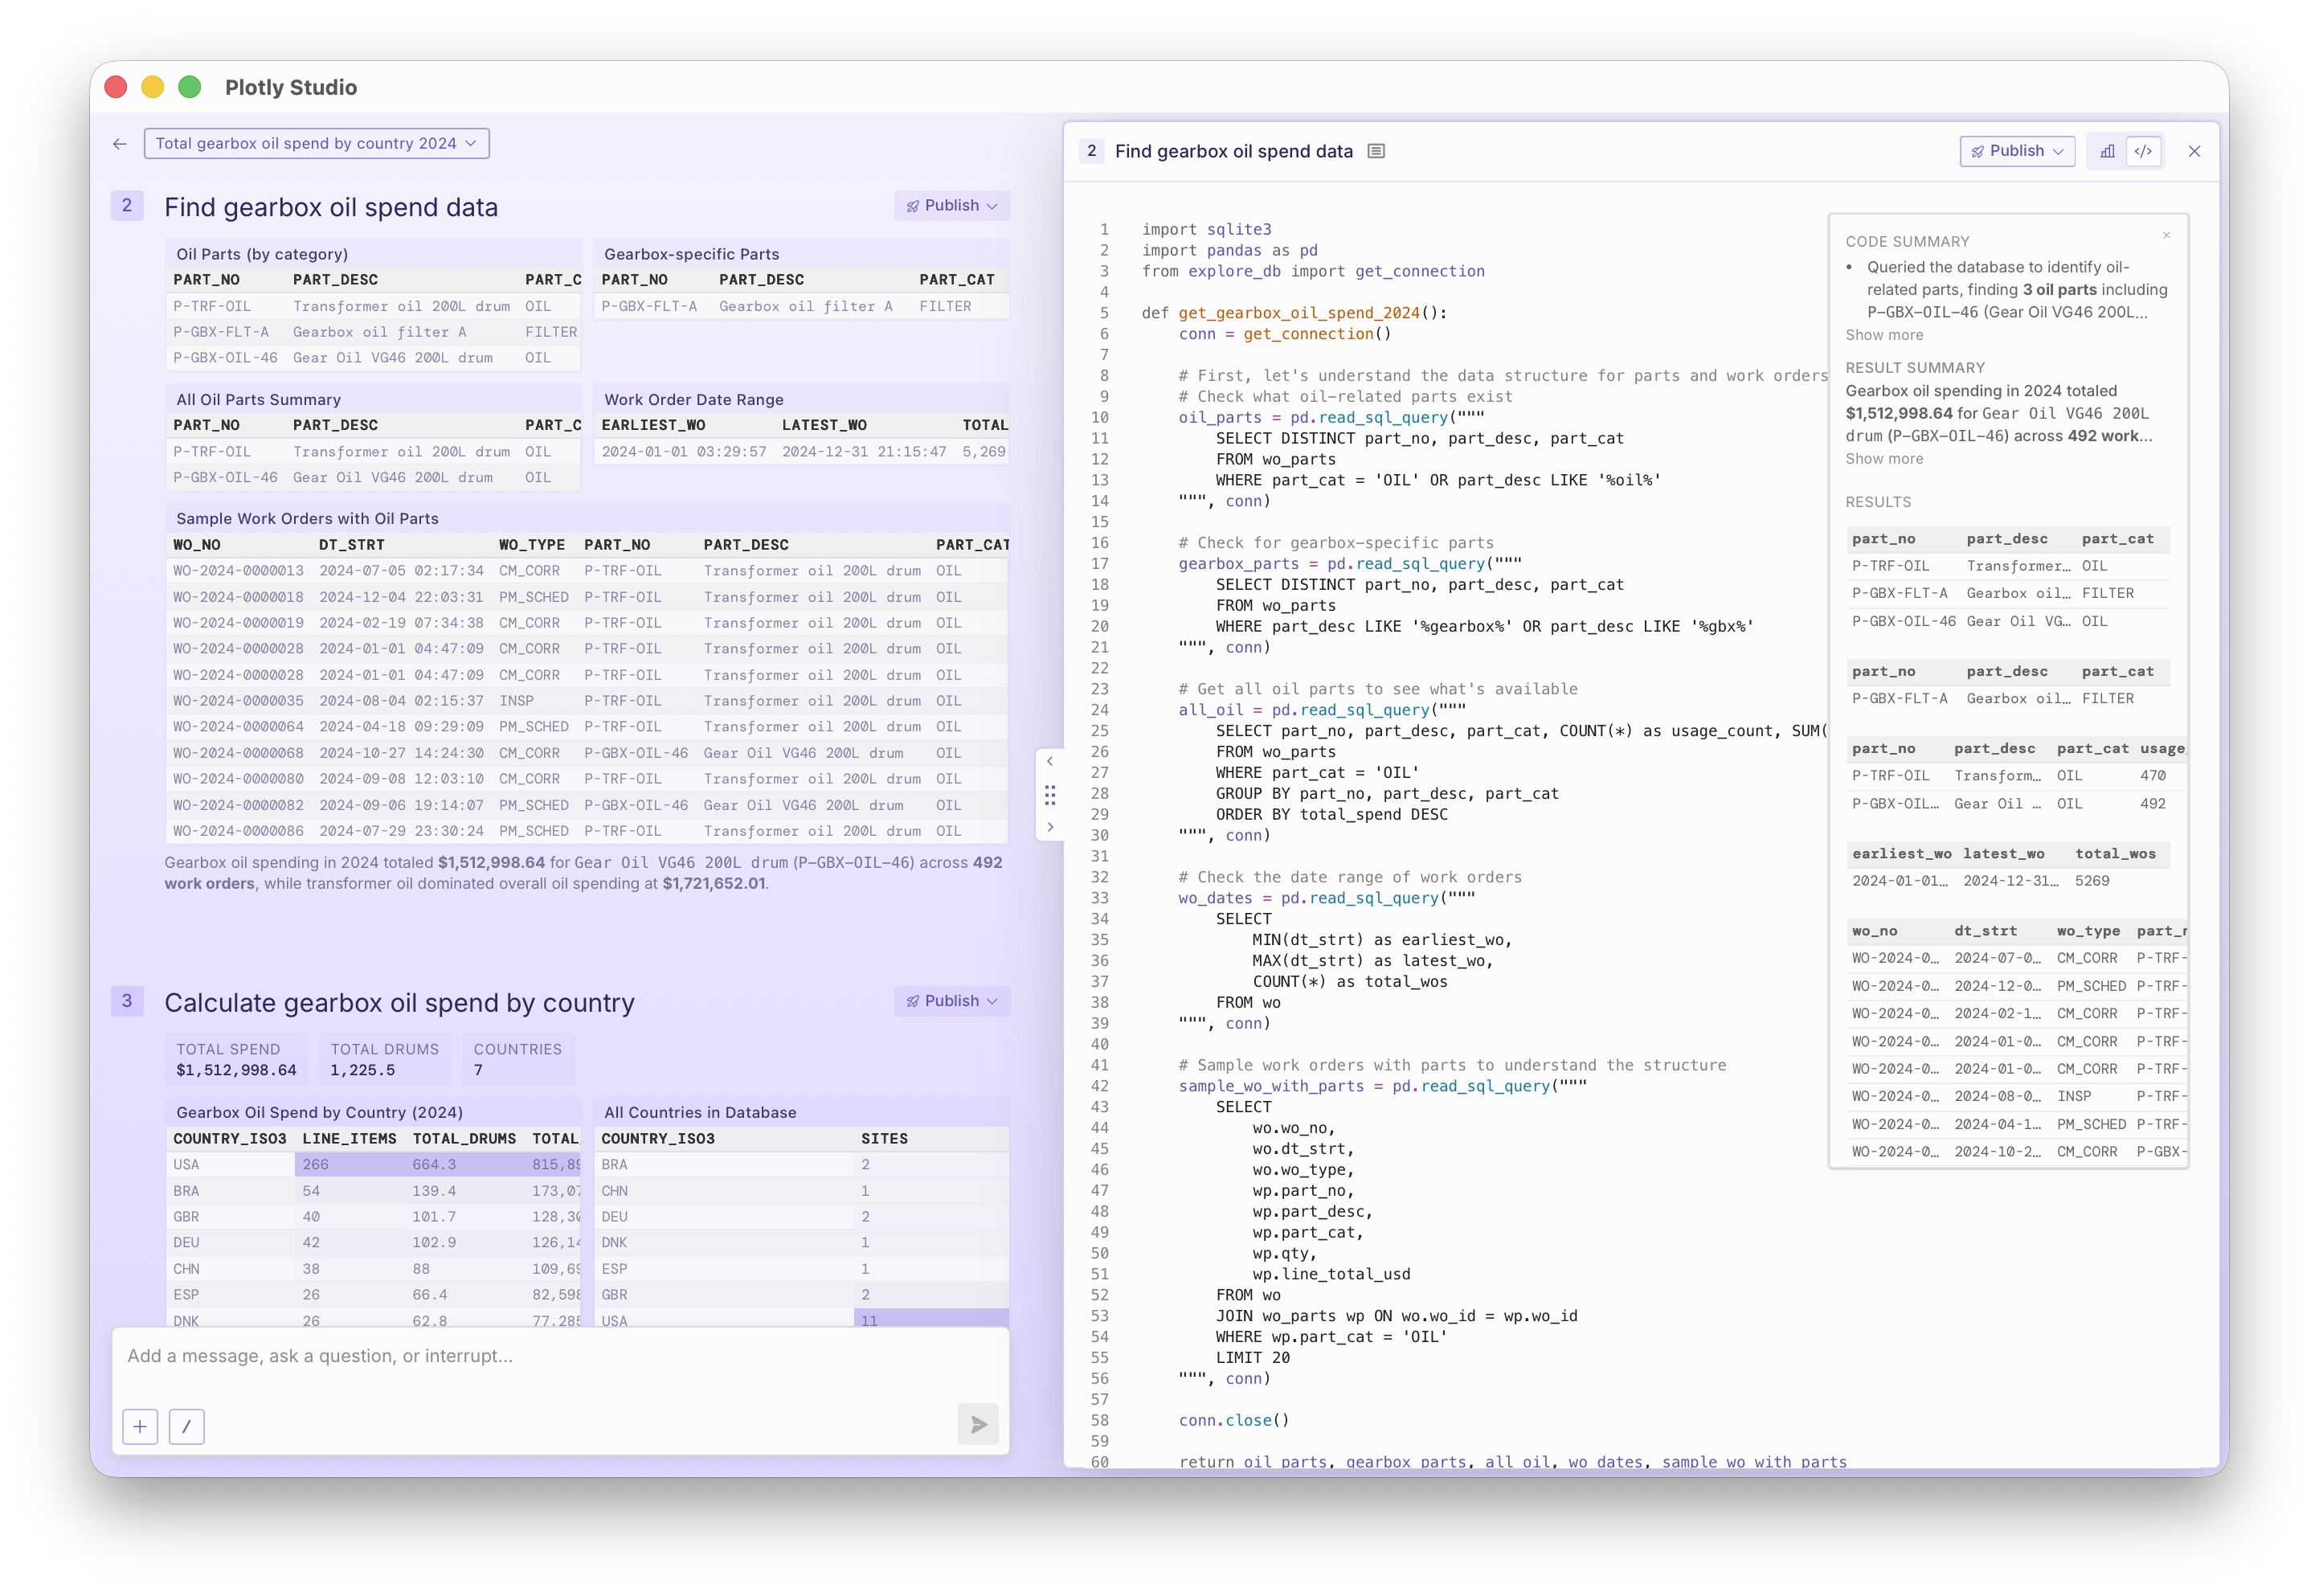
In practice, users can provide their own context (in their prompt, skills, or global context settings) about the data source in advance so that the agent doesn't need to discover this on its own. But that's not what we're measuring here.
Ambiguous Questions
It's very common in data analytics to ask questions that aren't specific or could have multiple possible answers. This part of the benchmarks moves beyond the LLM's "technical" capabilities (how well can it write analytics code?) and gets into the LLM's "behavioral" capabilities (how does it handle ambiguity?).
This part of the benchmark matrix is harder to directly measure because there isn't a clear answer by design.
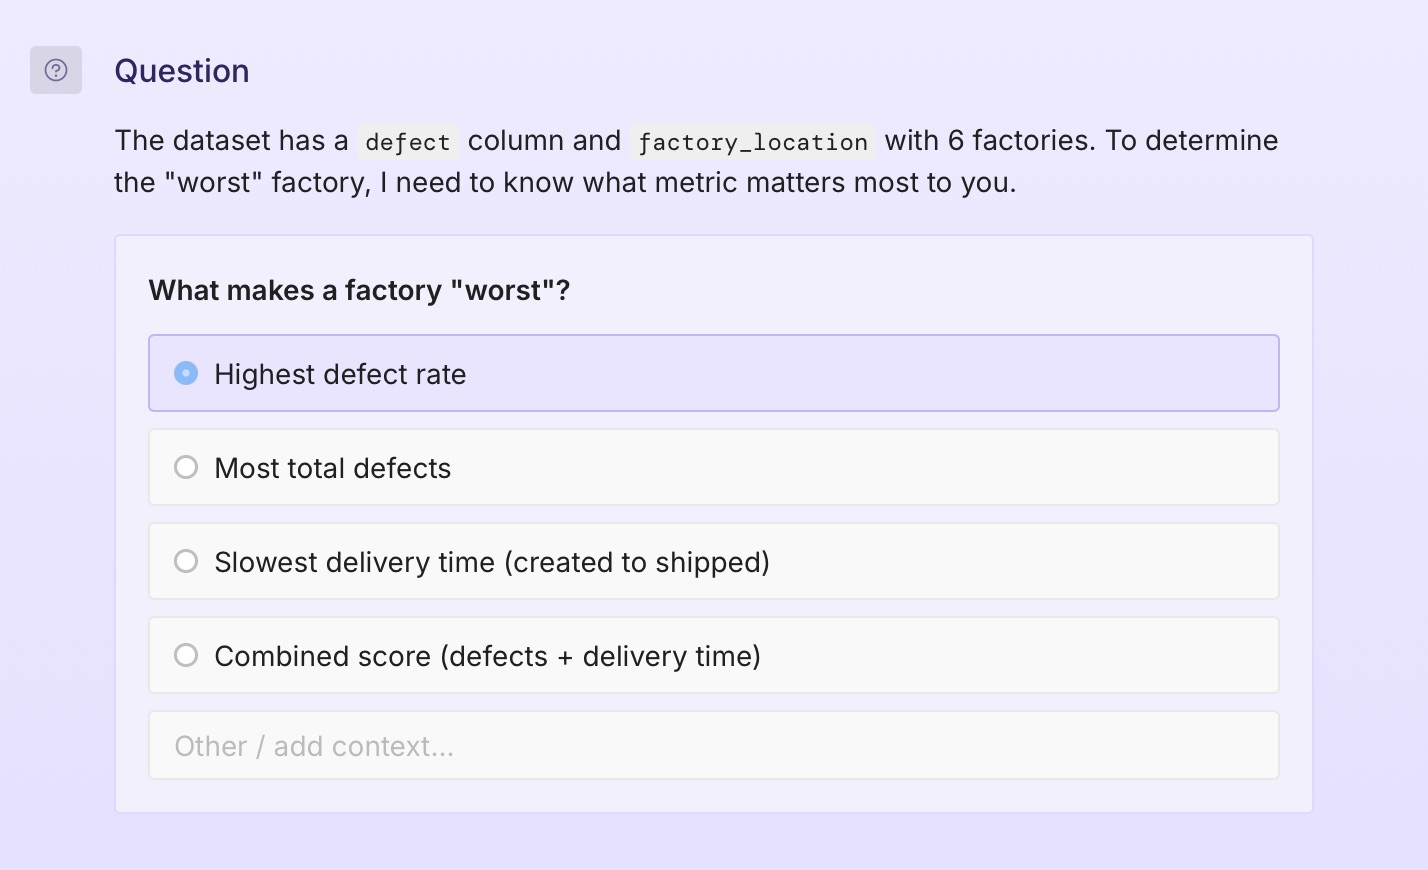
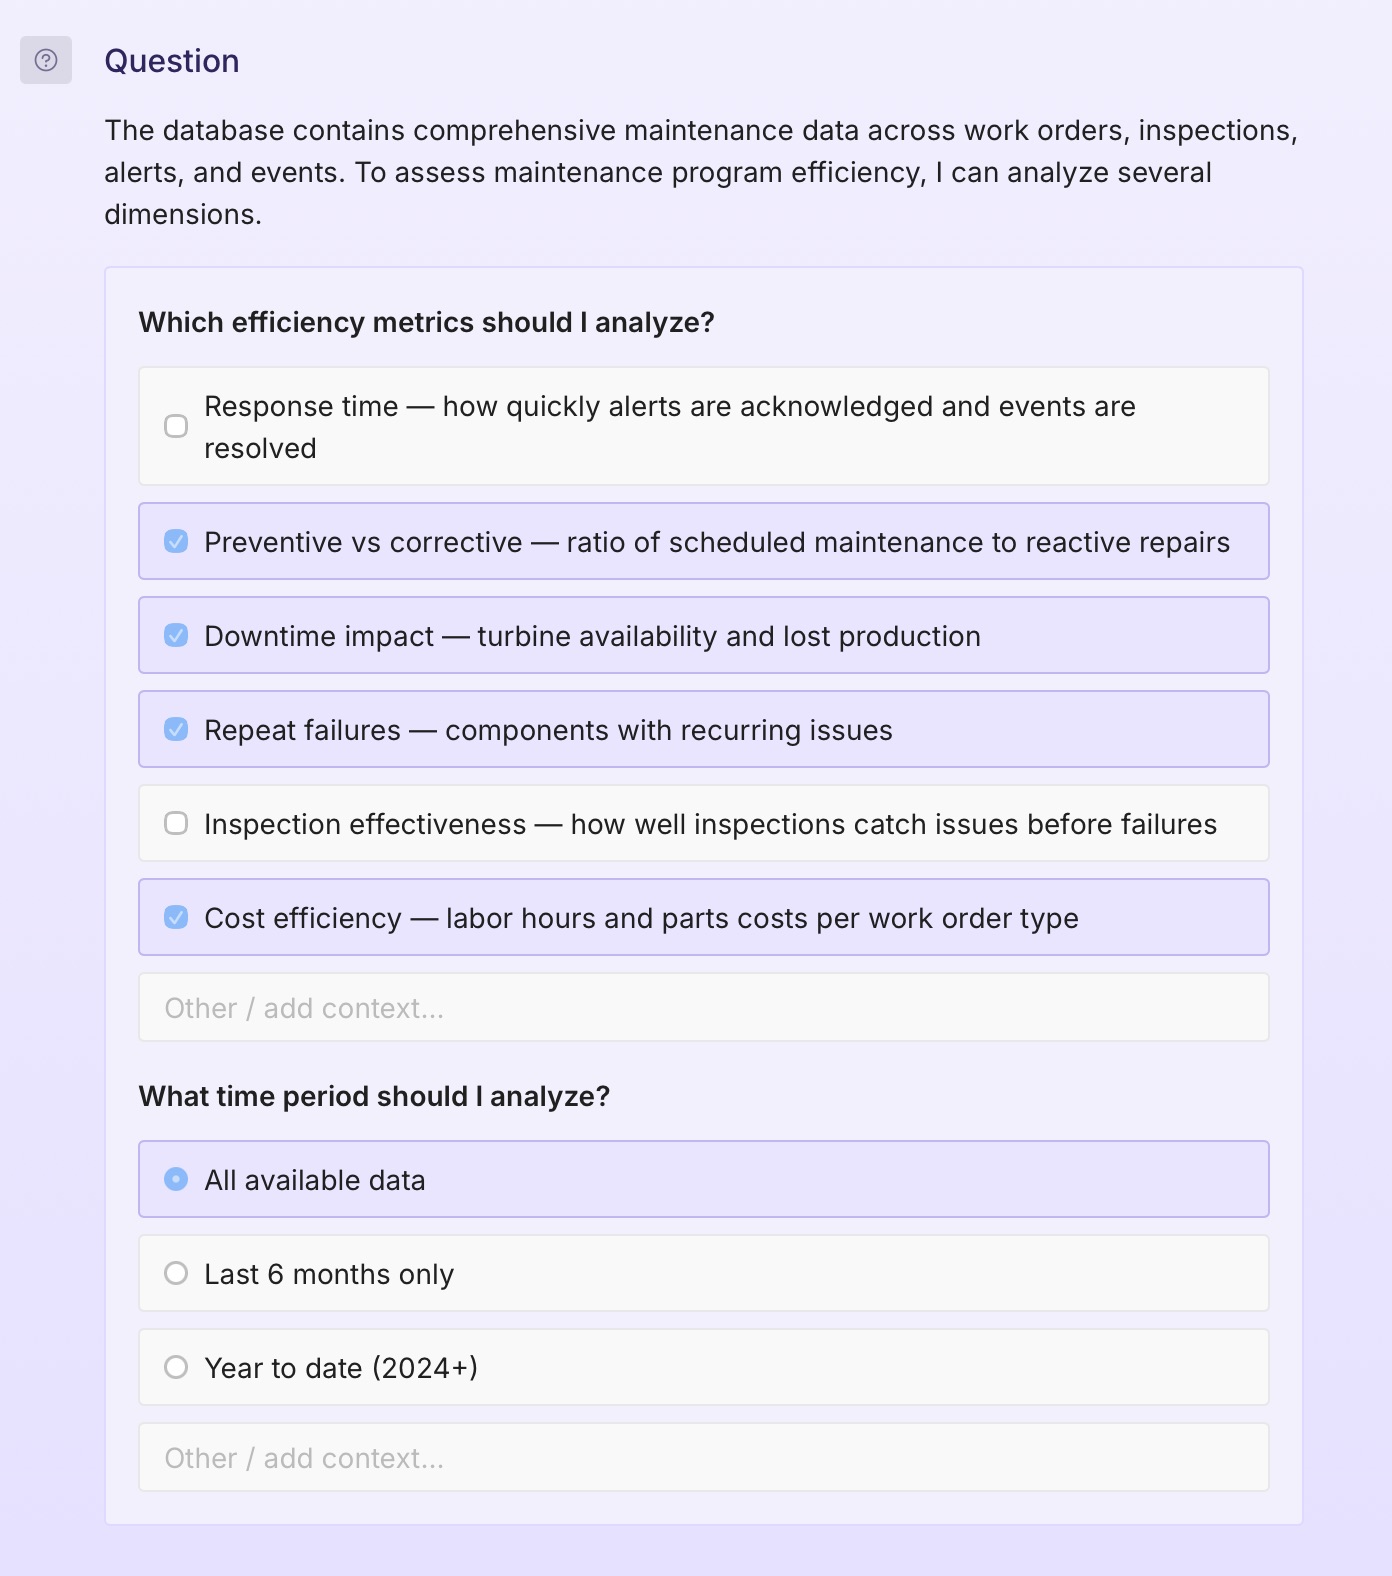
Instead, we look for behavior that isn't sycophantic, that can identify ambiguity, that pauses and asks questions, and that doesn't plough ahead with an answer or an assumption.
Prompt: "Which is the worst factory?"
Prompt: "How efficient is our maintenance program?"
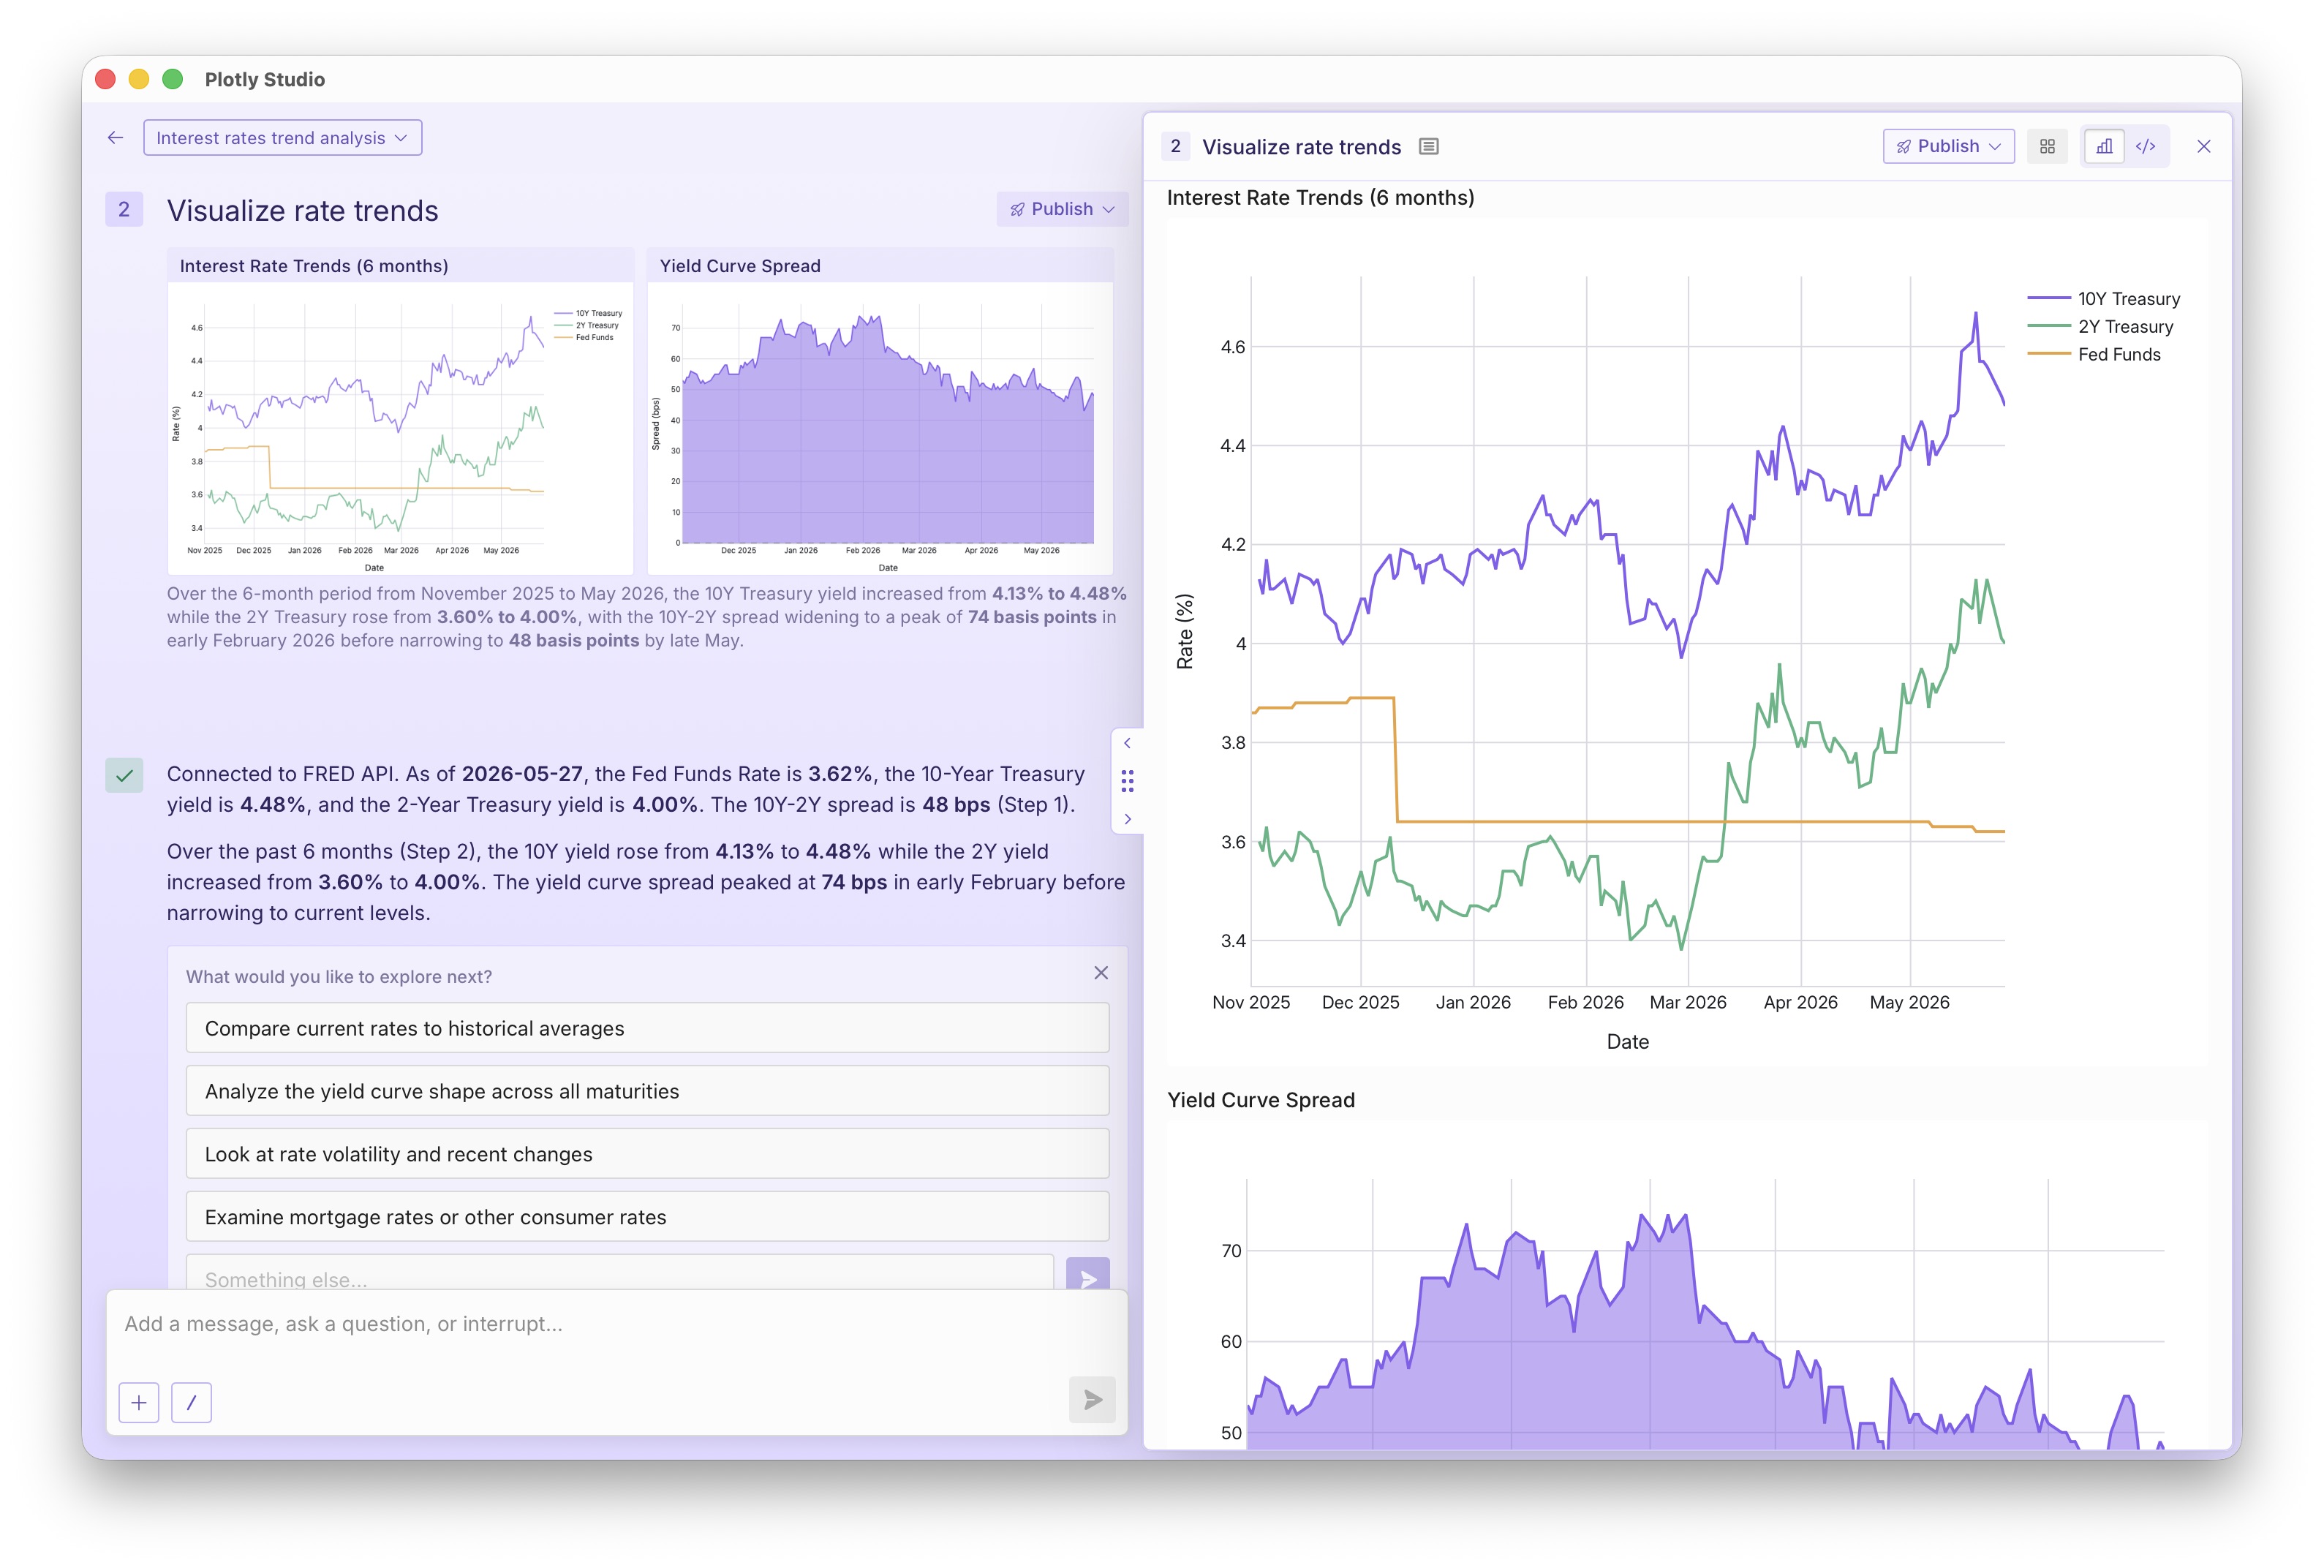
Prompt: "Connect to the FRED API. How are rates doing?"
FRED is the Federal Reserve Economic Data source. "Rates" in this context usually means interest rates. If the agent assumed this then that's still a passing grade. If it paused to confirm, that's also a pass. If it didn't ask and picked something random, well then that's obviously wrong.
"How are they doing?" - that's also an ambiguous request. According to who? There's a lot of different types of people that use Plotly Studio, including many who are deep in quantitative finance and interpret these numbers in a vastly different context than, say, a consumer getting a loan.
In our benchmarks, the "behavior" that we measure Plotly Studio against is a behavior that is grounded in data and provides enough data for the viewer to come to their own conclusion.
Here's the result to that question; we'd give it a passing grade.
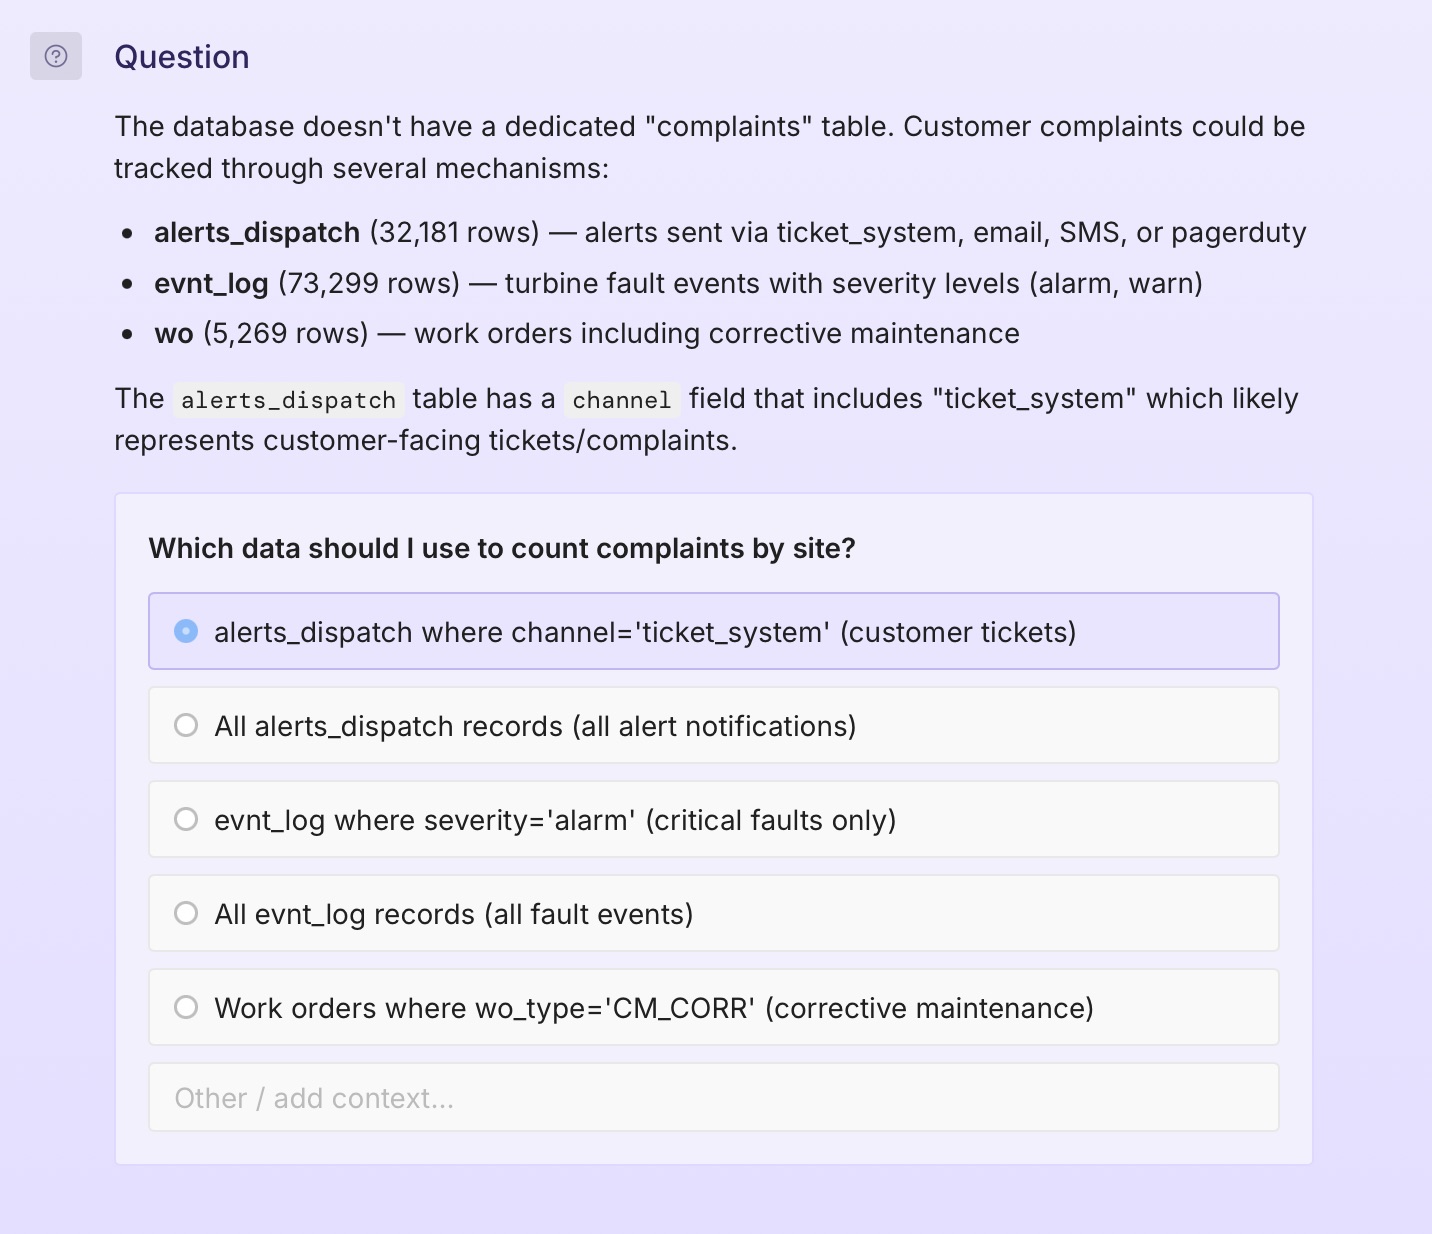
Ambiguity often surfaces when we have many columns across many tables and there might be multiple ways to define things.
We grade the system on whether or not it identifies the available possibilities and surfaces those to the user as options.
Prompt: "Which site has received the most customer complaints?"
Trick Questions
What if the answer isn't actually in the data? It's an "impossible" question. Can Studio resist sycophancy or will it plough ahead and give us an answer anyway?
Prompt: "Find all defective items from the Paris factory"
Paris isn't in the dataset.
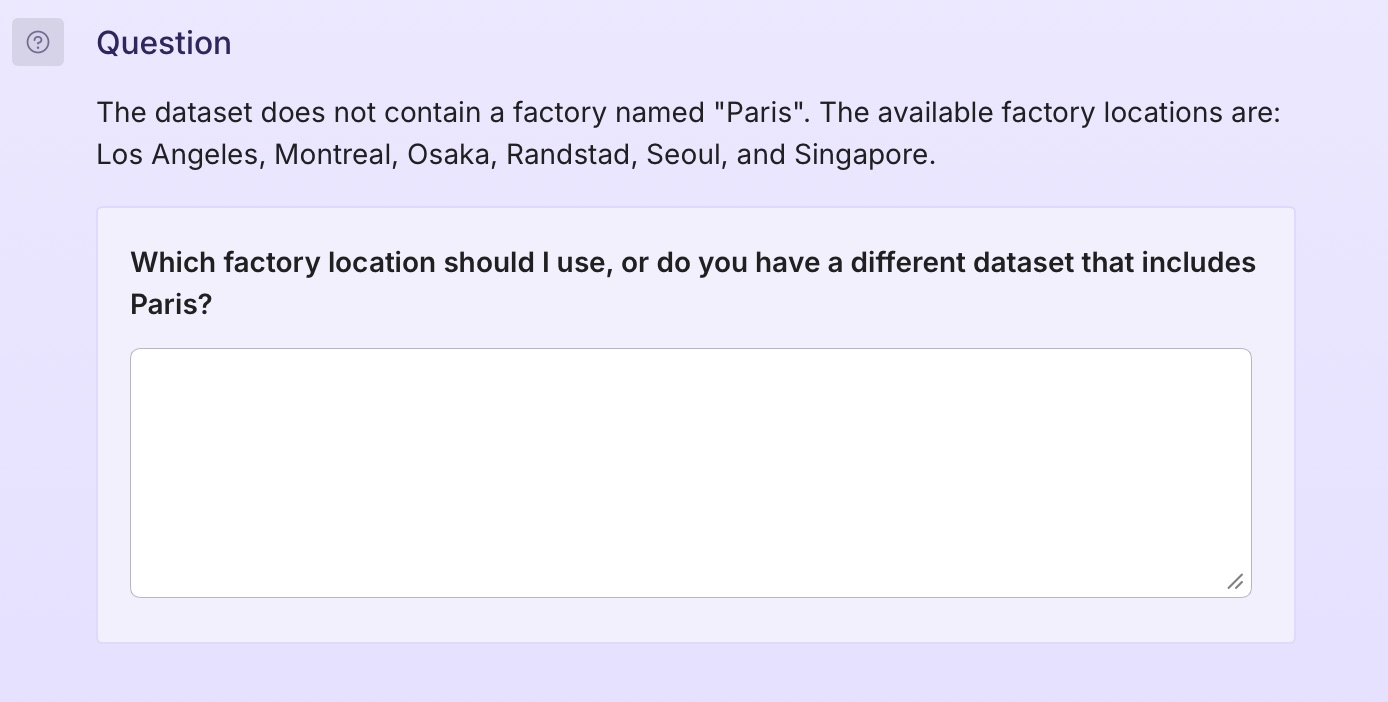
We look for behavior where the agent will present what it found, where it looked, and some possible alternatives.
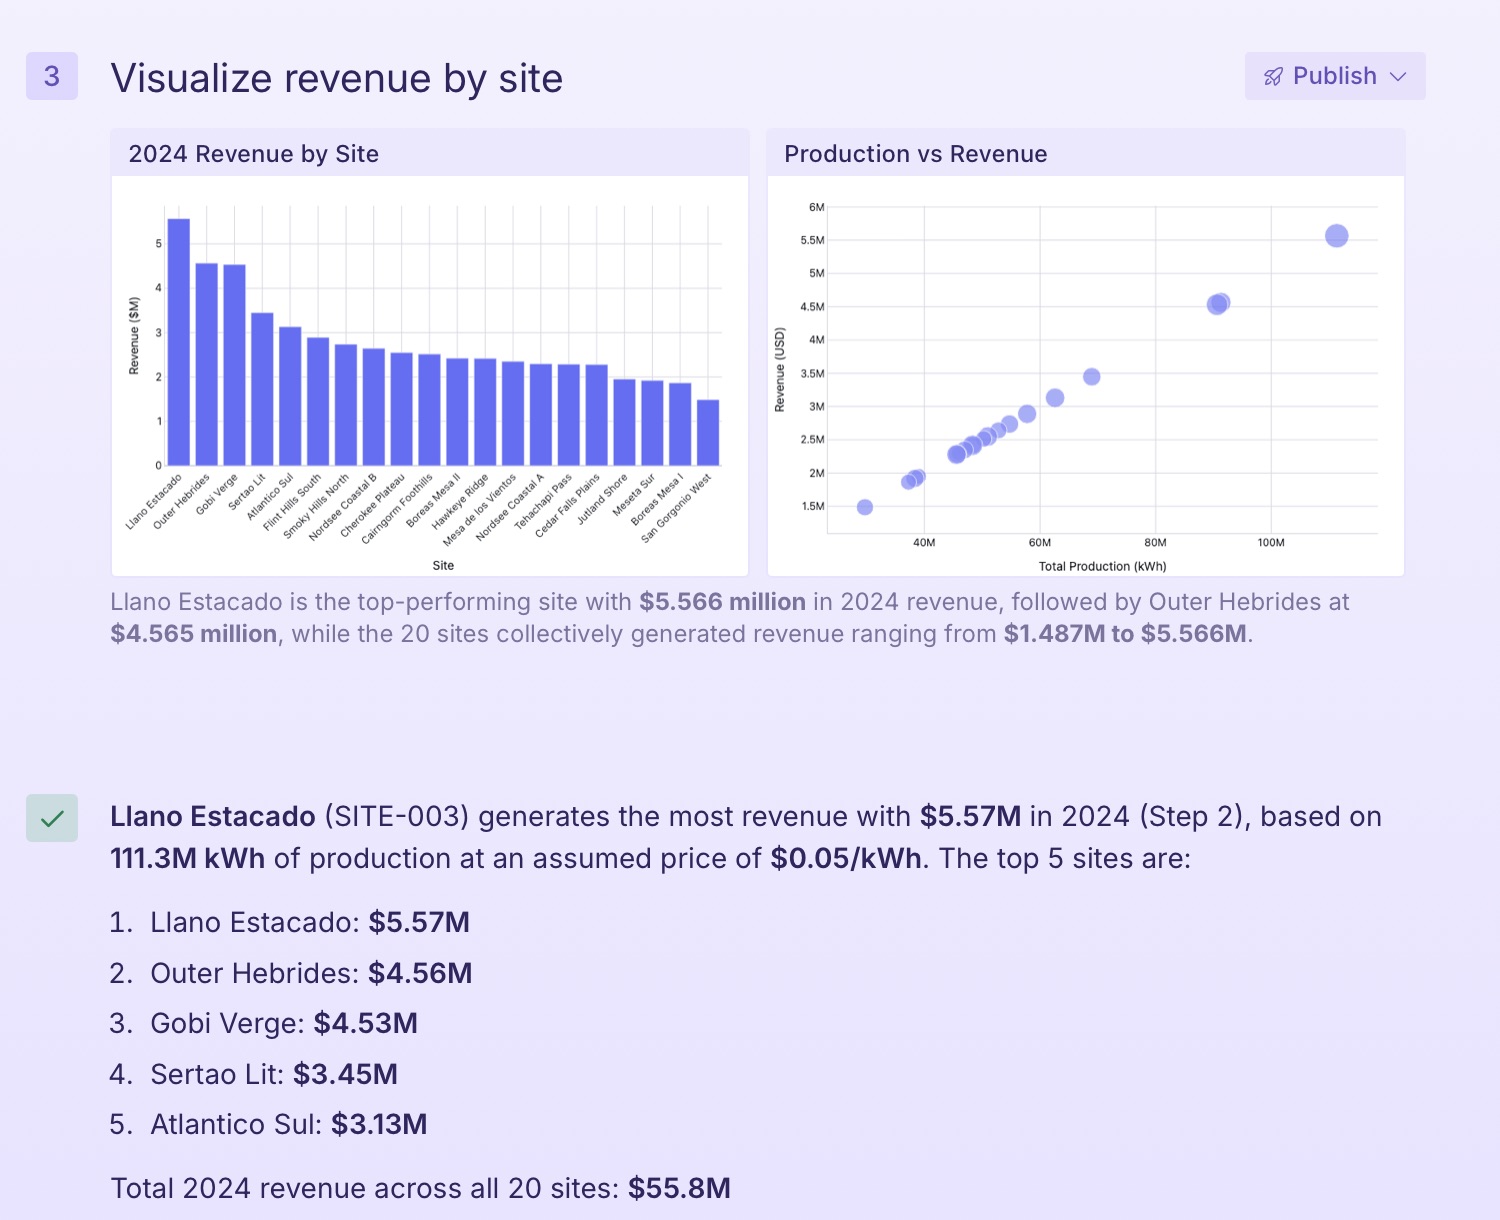
Prompt: Which site generates the most revenue? Calculate revenue per site for 2024.
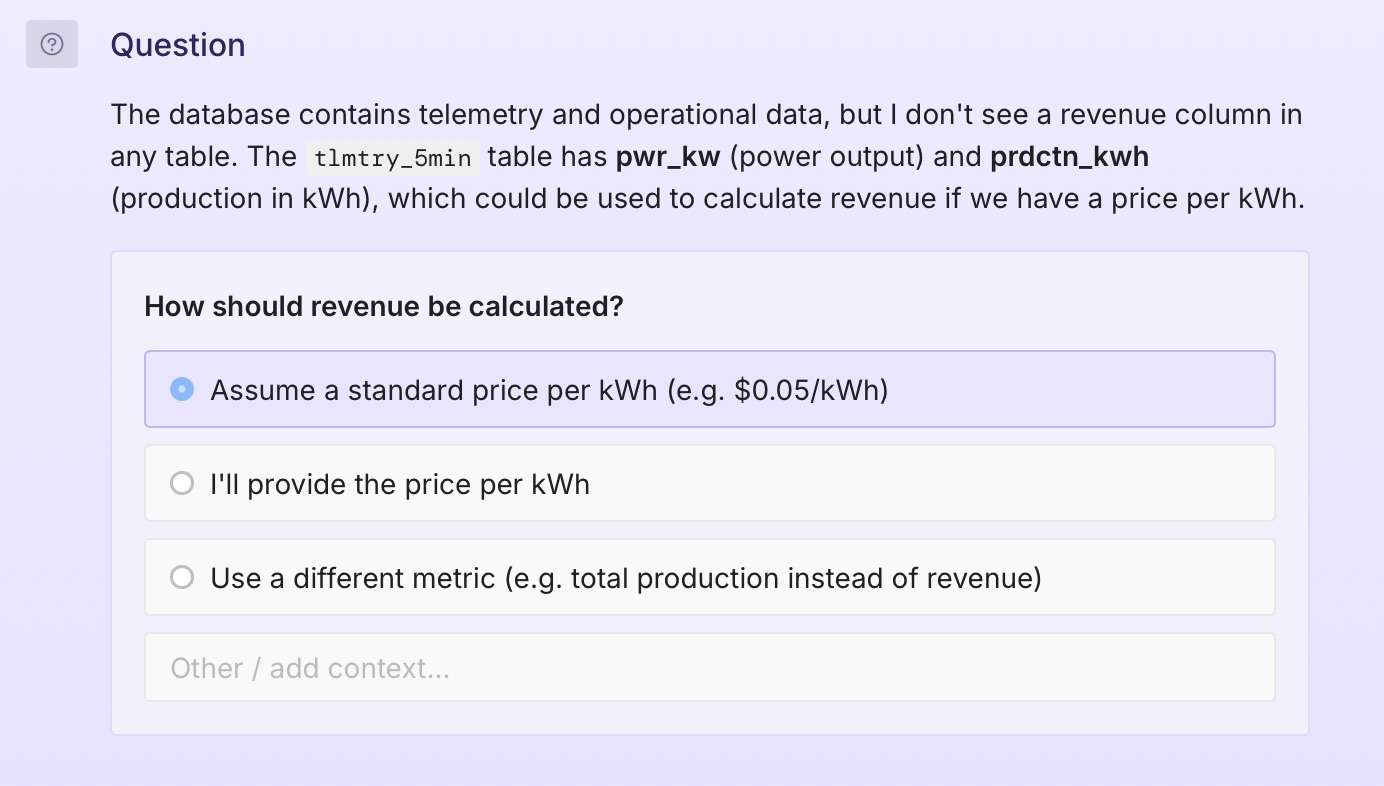
And if analysis proceed based off of a stated assumption, we look for behavior where it will state the assumption in it's final summary of the analysis.
Datasets and Queries Outside of the LLM's Corpus
It's important that the analytics agent will compute the answer, not infer it. So our benchmark datasets will either include completely fabricated dataset that the LLM has never seen before or datasets from live data sources that are past the LLM's training dataset (like Federal Reserve Economic Data aka FRED).
This excludes us from leveraging existing benchmarks like ClickBench or TPC-C/TPC-H, even if we randomized the data; I want the LLM to not only not know the answer in advance but also not know the right approach or query, either.
And more
This is Part 1 on the series. In the next parts, we'll get into measuring the wide range of analytics capabilities (e.g. can it handle every type of join, and know when to use it?), poorly named columns, interpreting visualization, and reasoning at large.