
Publish Anything, Methodology, Refreshed App Design, Skills UI
Big release Plotly Studio release today, including a few features that we've been thinking about and circling around for a few months now.
Publish Anything, Publish Everything
We started Plotly Technologies because we believed it should be vastly easier to share data, graphs, and analytics (screenshots begone!).
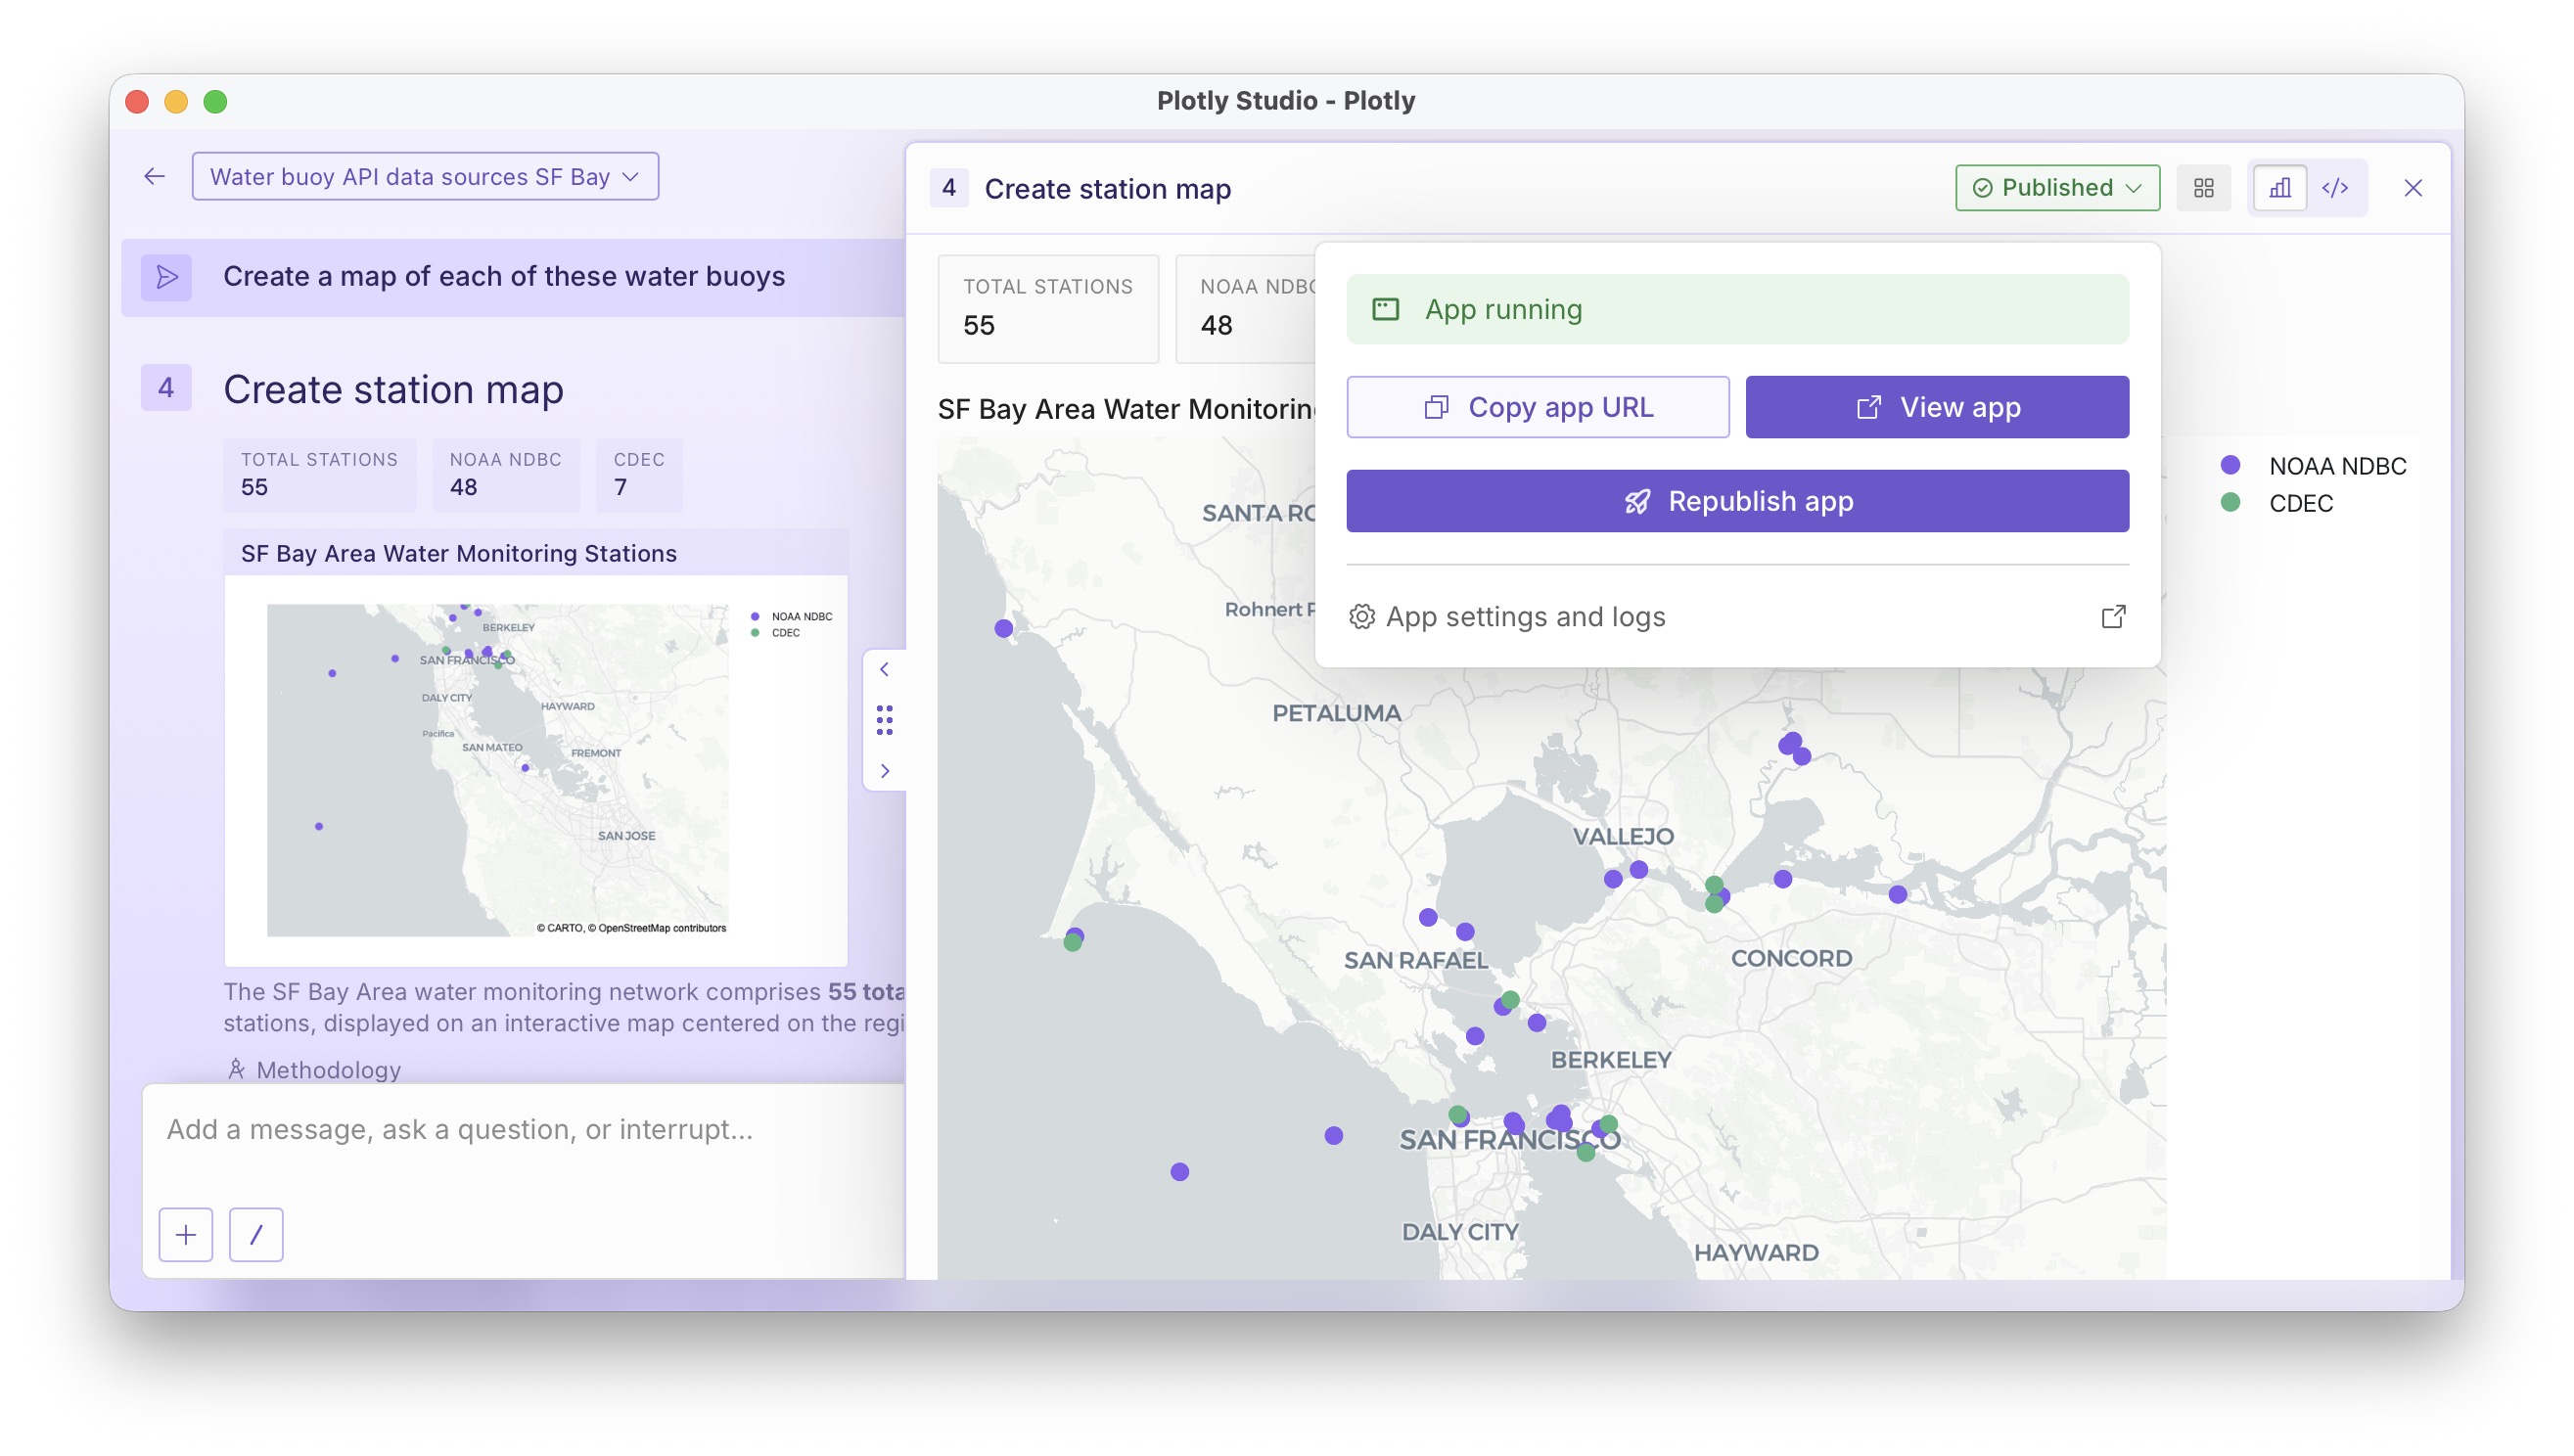
This week's release of Plotly Studio adds a "Publish" button to every step, regardless of its "type". Studio's steps generate Python code that renders data as tables, stat cards, graphs, apps, or markdown. Previously, only the full blown Dash app steps could be published.
Now every step's artifacts can be shared with a click of a button - no fussing with deployment scripts, it just works.
Publishing is nicely integrated into Plotly Cloud, our managed service at cloud.plotly.com, and Dash Enterprise, our self-hosted platform built for internal deployments at F500 companies.
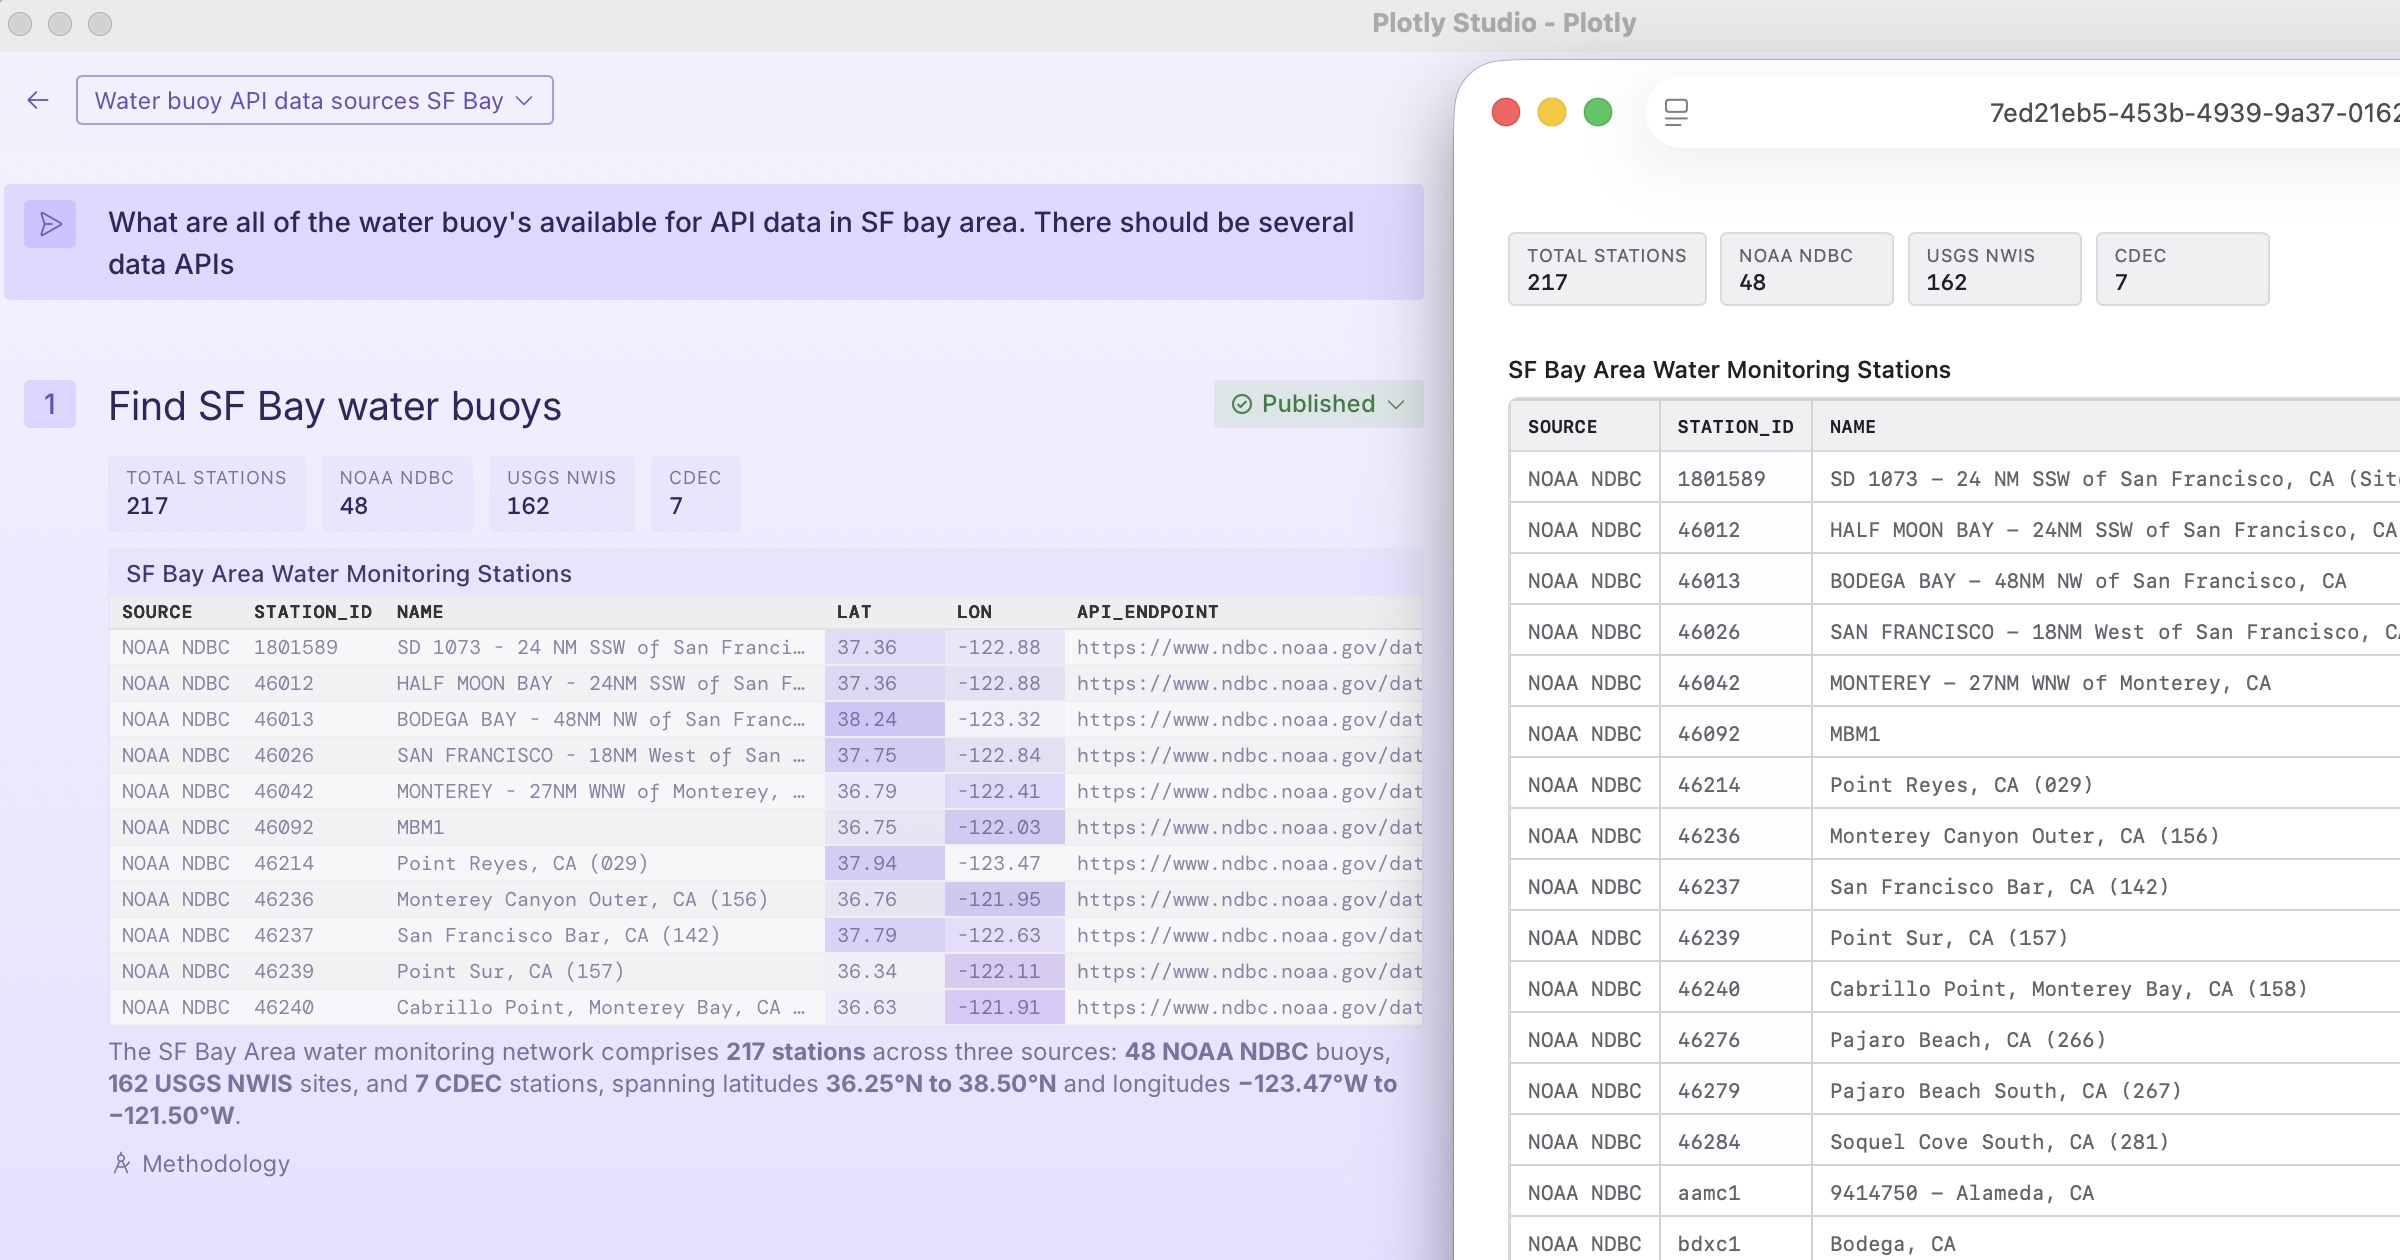
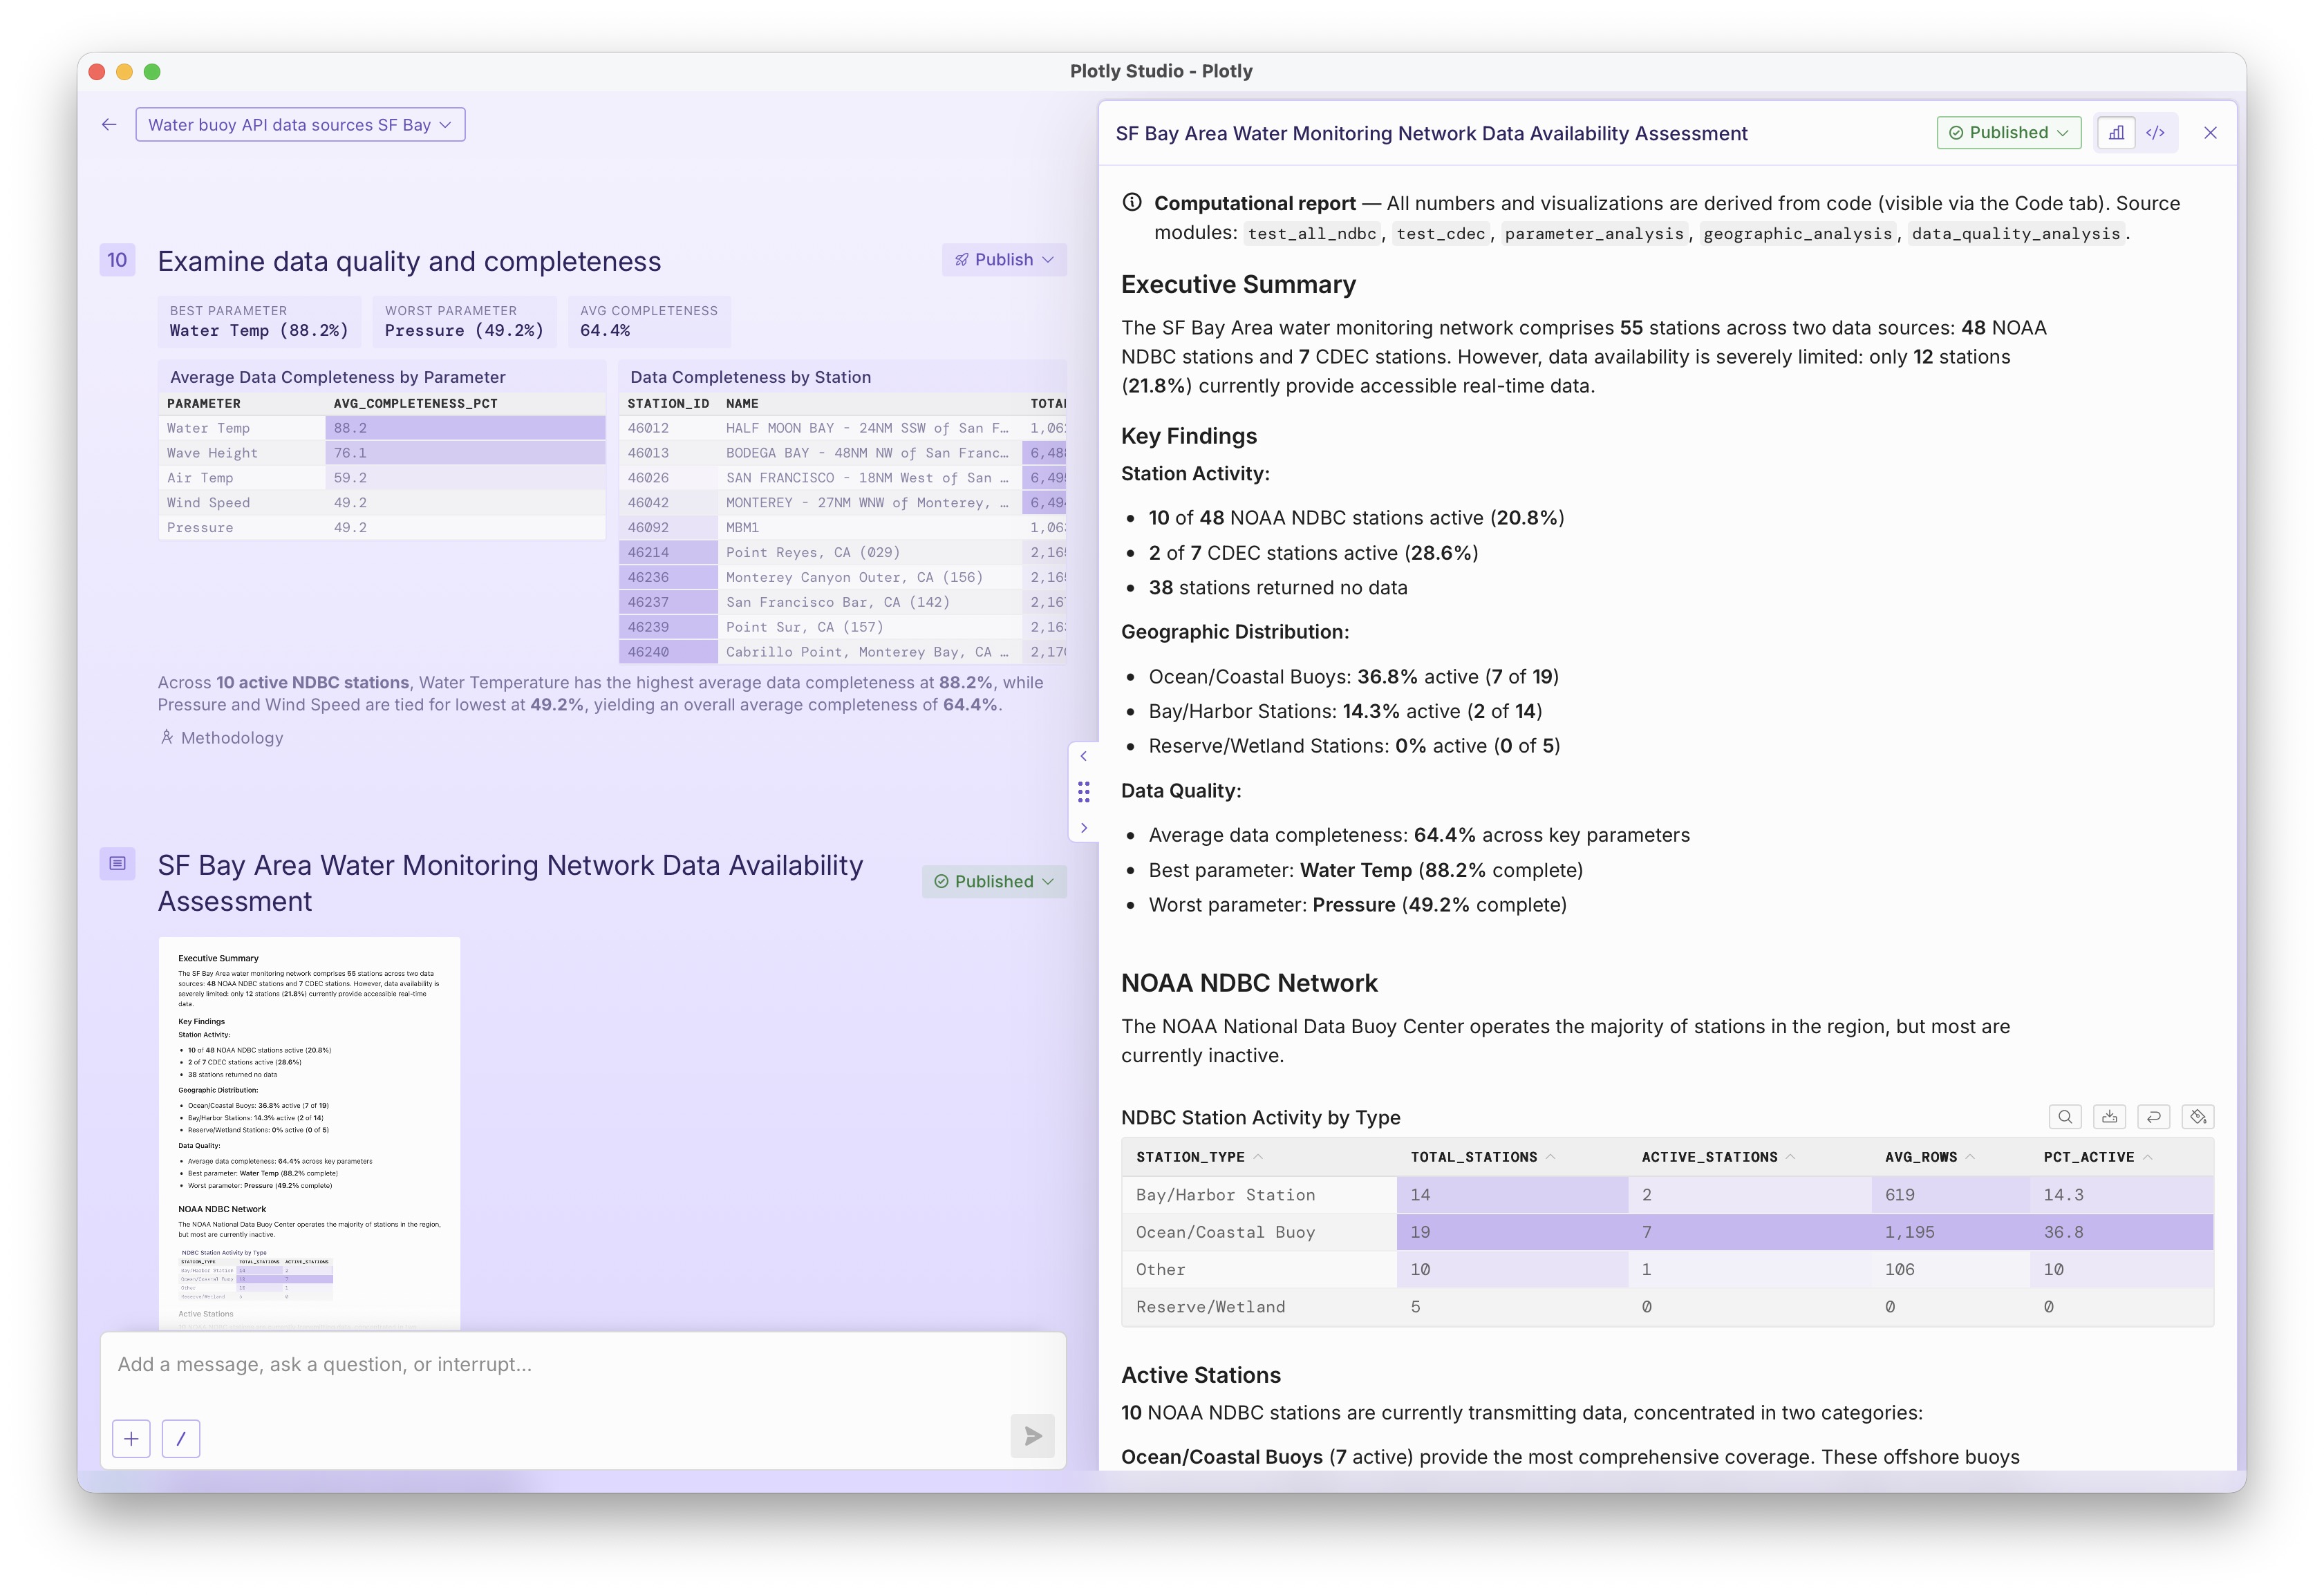
Methodology
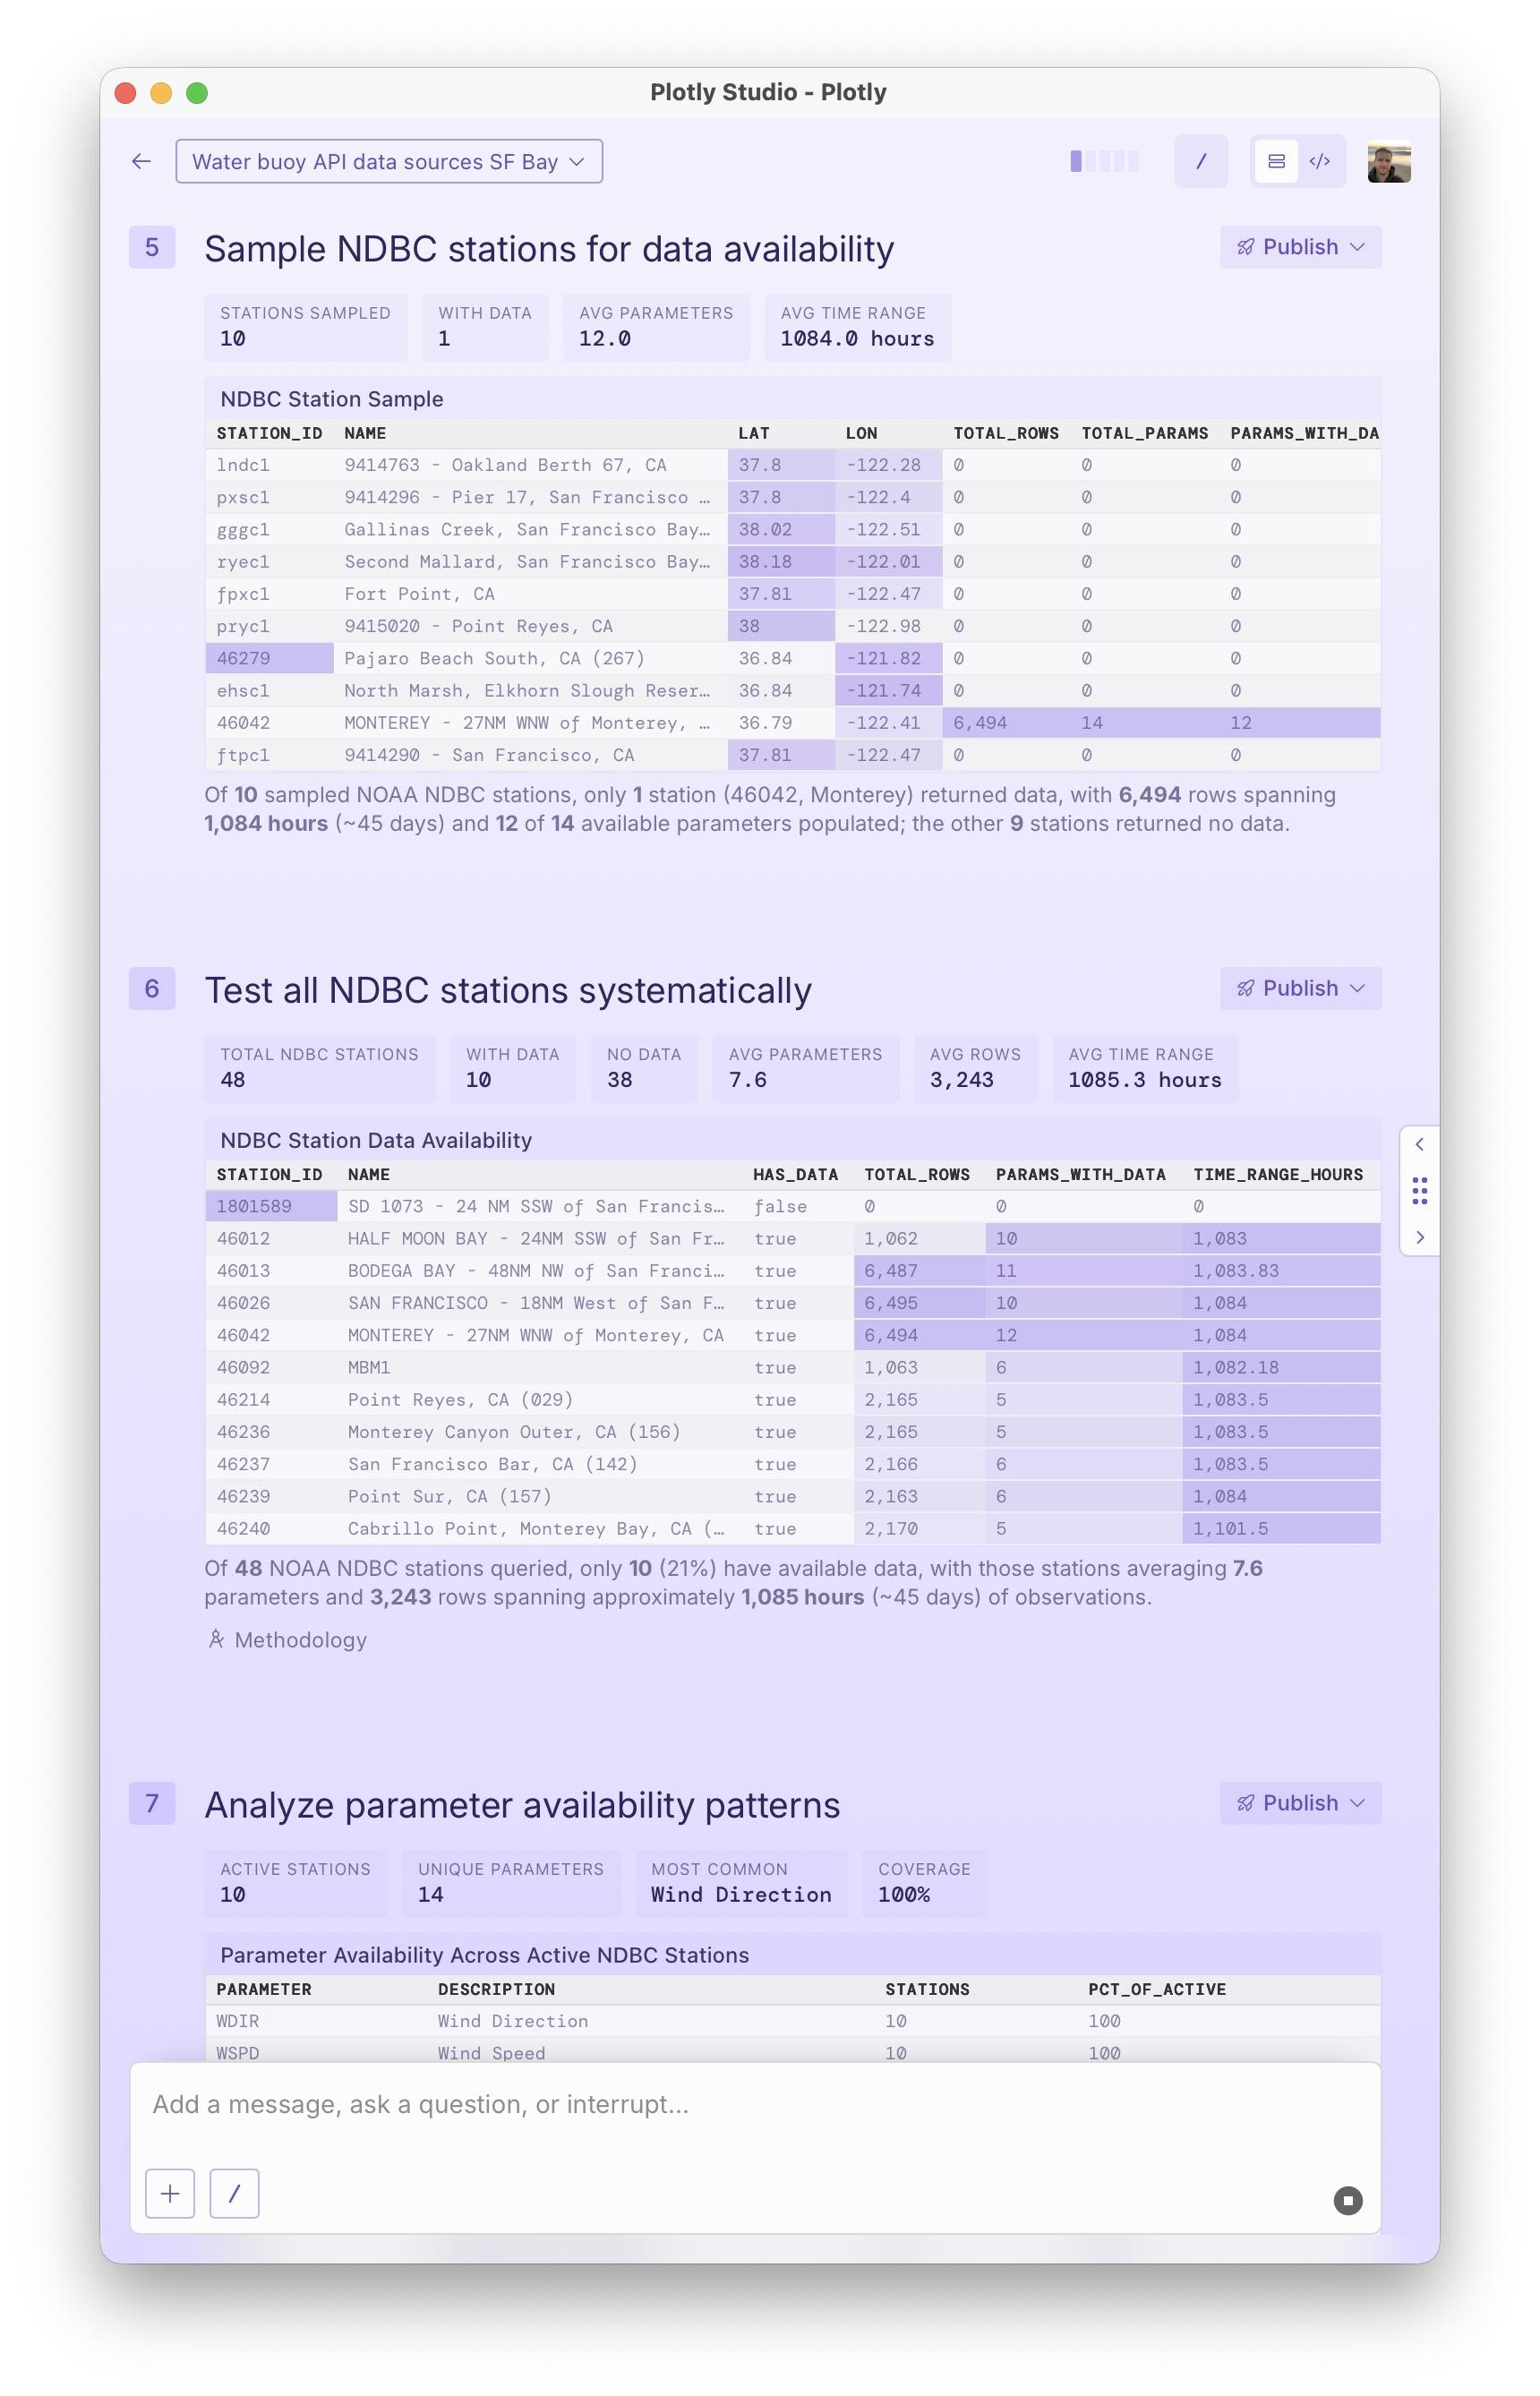
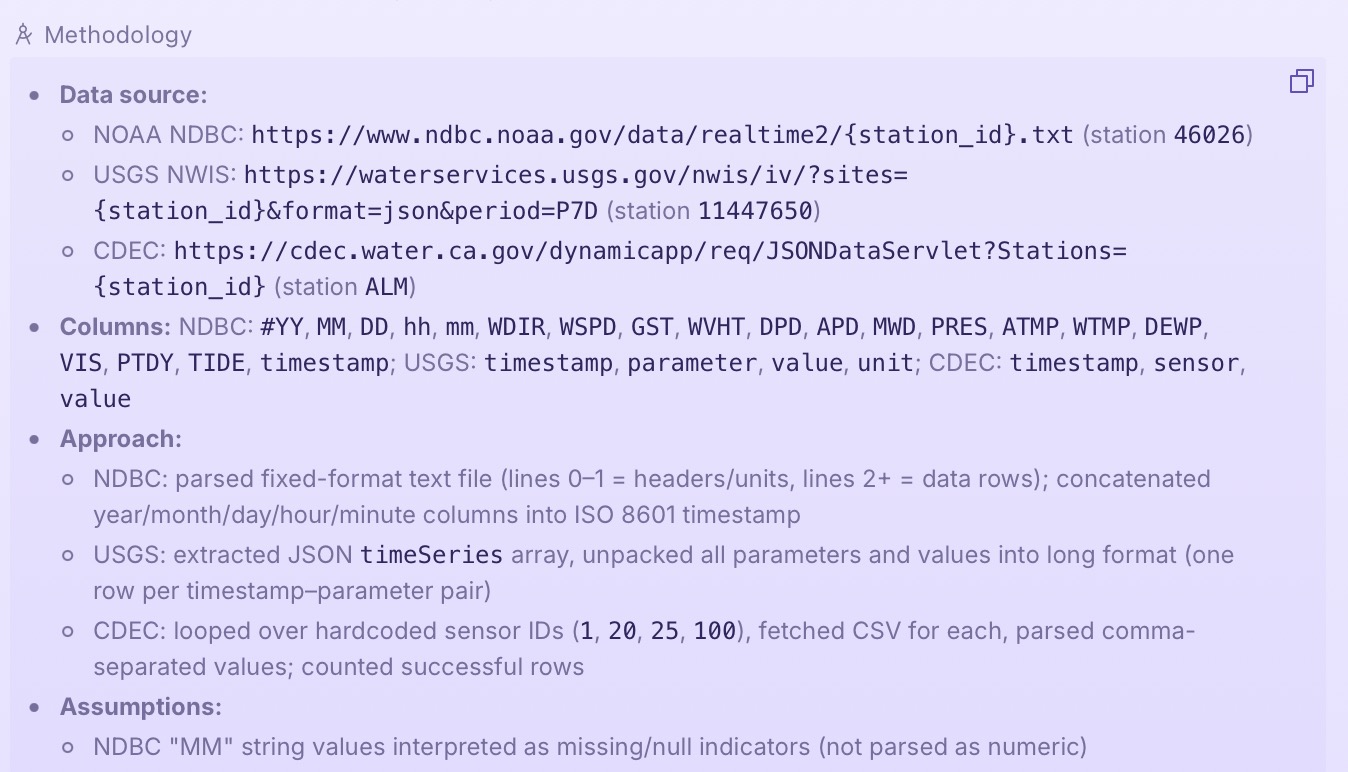
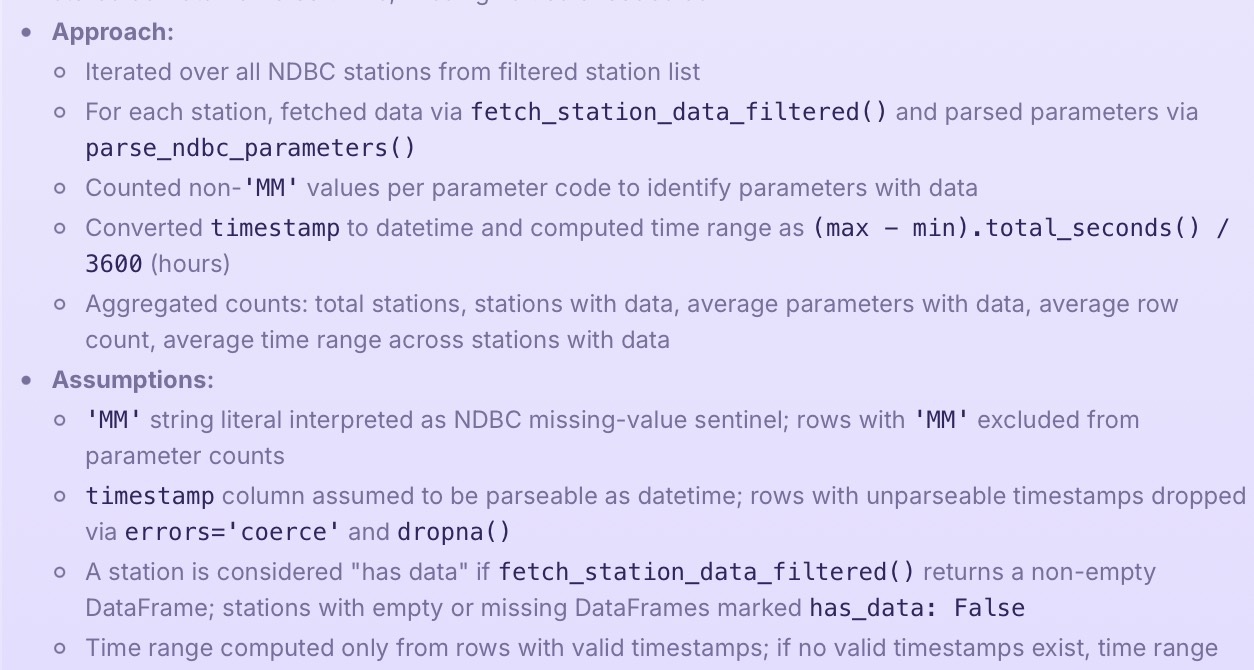
In this release, every step includes a "Methodology" section that breaks down the analytics approach of the step: the data source, the columns, the formulas, the assumptions, etc.
Trust and verification are among the most important problems to solve in AI-assisted analytics. Methodology is one of many features we've designed to address these problems.
I wrote about this at length in a previous post: https://chris-parmer.com/methodology/
Here are a few screenshots of what Methodology looks like in today's release.
Refreshed App Design
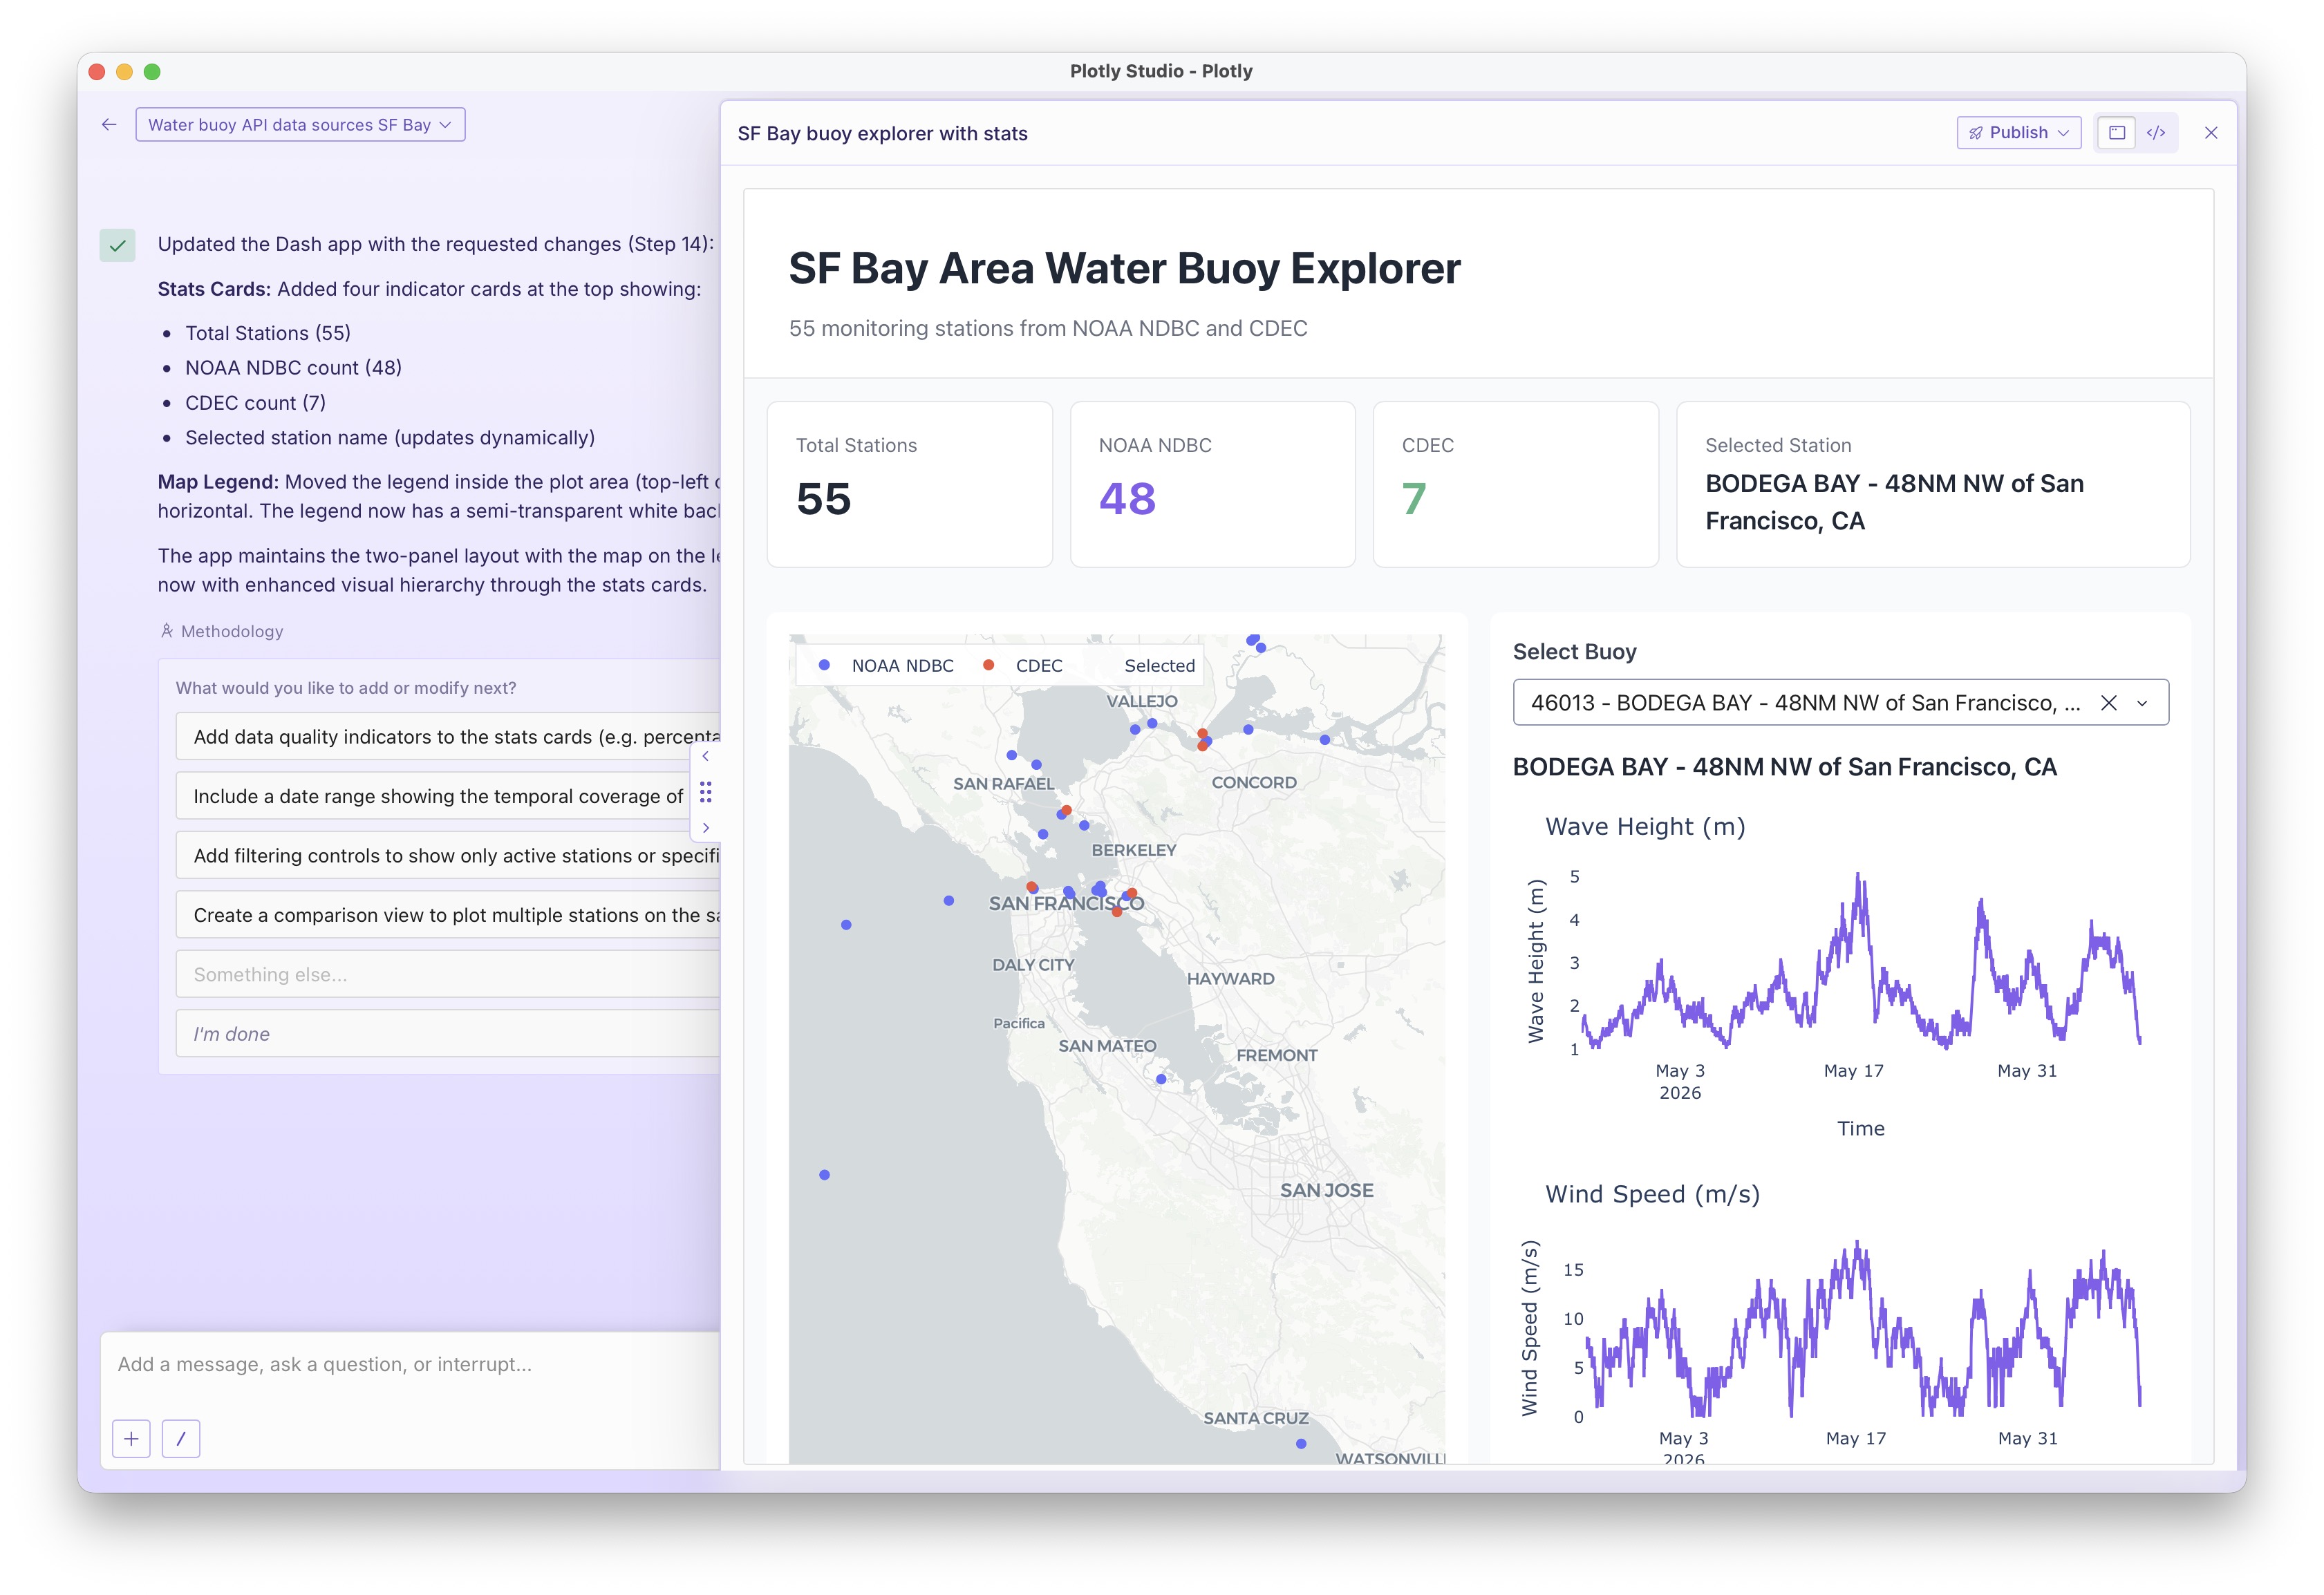
We tweaked the look and feel of the default Dash apps in Studio and they're looking very clean. Many AI website builders make apps that look all the same these days (purple gradients, etc) that are steered more towards marketing pages than rigorous data apps. We've been designing our apps to have a high data-to-ink ratio and let what's important shine: the data visualization.
Skills UI
Skills are slash commands - shortcuts to run predefined prompts. We ship 9 skills out-of-the-box for common data workflows and allow you to write your own.
We updated the Skills UI in this release with some nice quality of life features.
Skills are still available in the header:
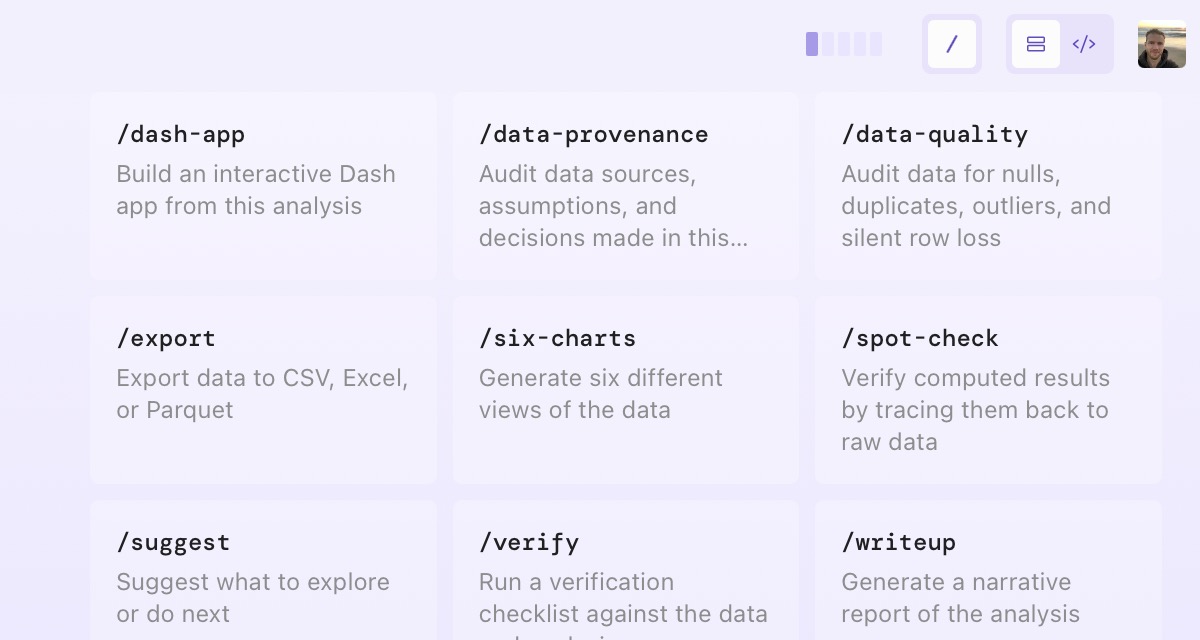
But now they also appear in your prompt with nice typeahead and search:
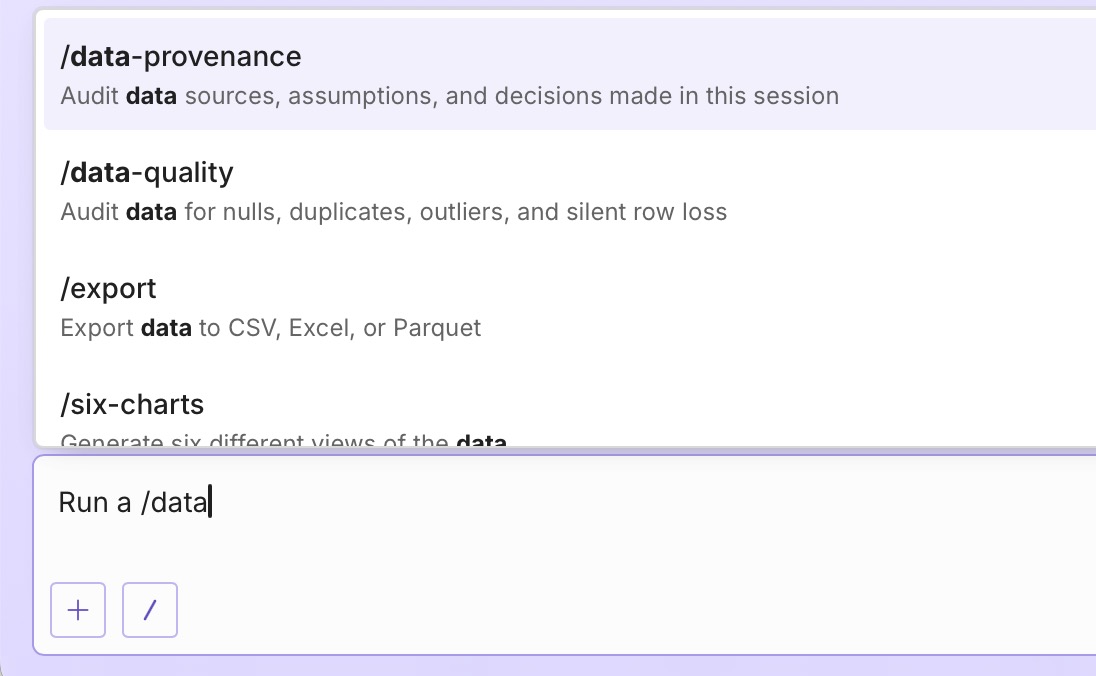
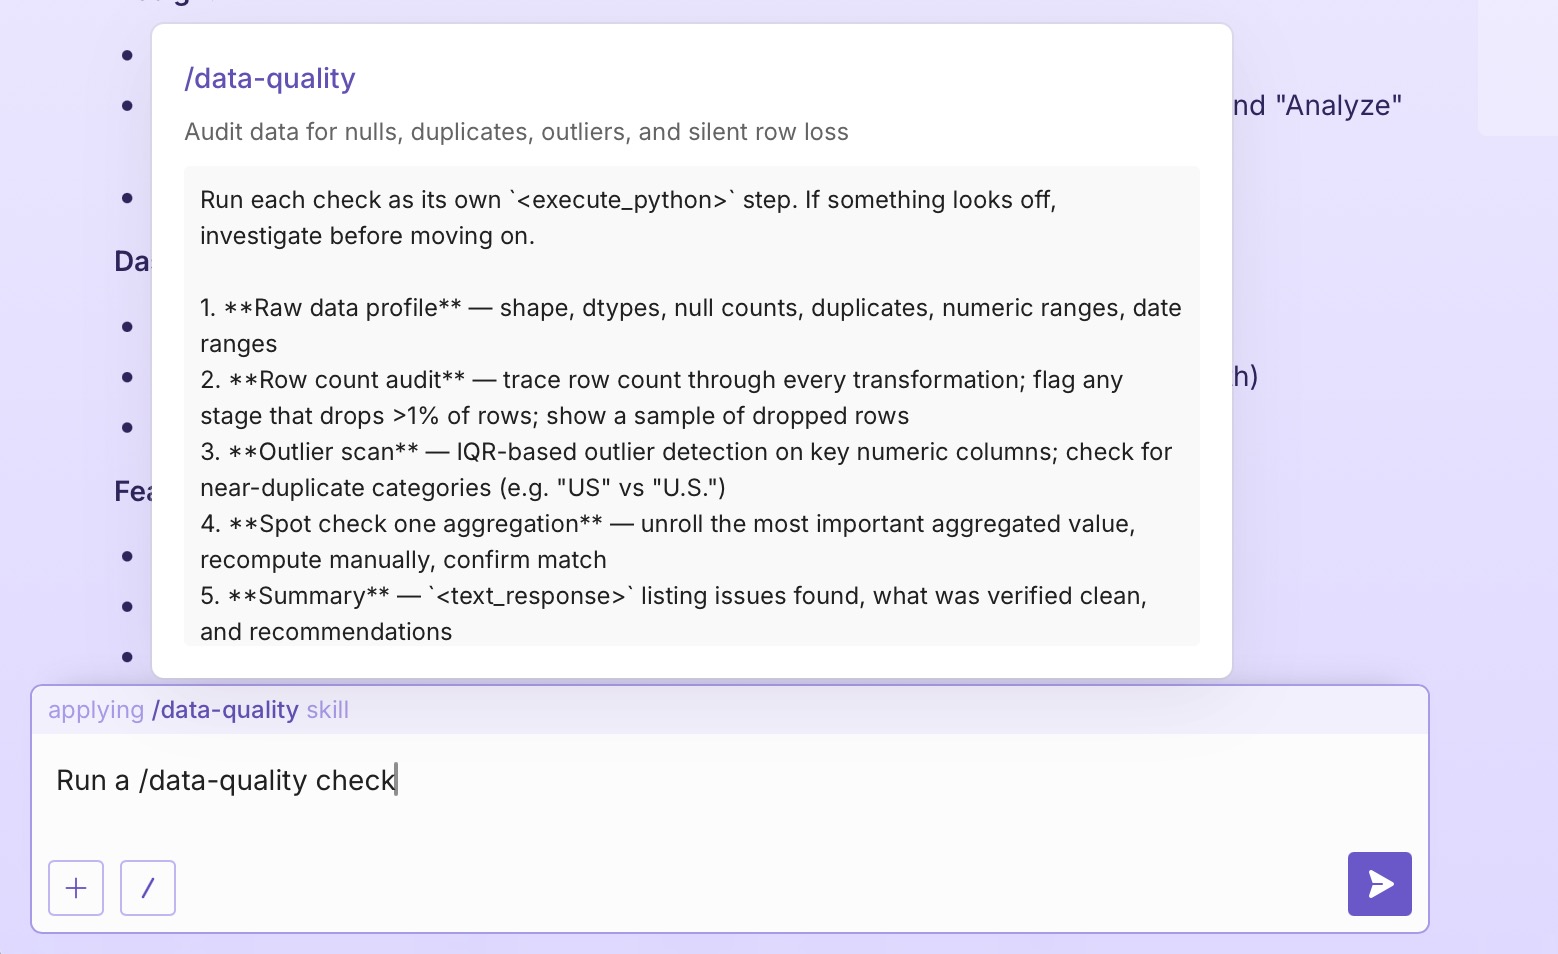
When you include a skill in your prompt, we show a nice little badge that indicates that Studio recognized it. This is such a nice touch to the UI - a lot of slash command UIs out there (I'm looking at you, Slack) really leave you hanging when you write out a command, giving you no indication that it's a "recognized" command until your press enter.
We also display the underlying skill content when you hover over the skill, so you can see the exact prompt. A lot of Skill UIs keep the skill content a secret and we think that's misguided; skills are meant to be examined, copied, forked, and remixed. The best part about seeing the skill content right up front is that you can always just copy and paste the content of the skill into your prompt and edit it directly; there's no need to dig into the internals.
That's a wrap for this week
Give these features a try and let us know what you think. You can get started for free here: https://plotly.com/studio.