
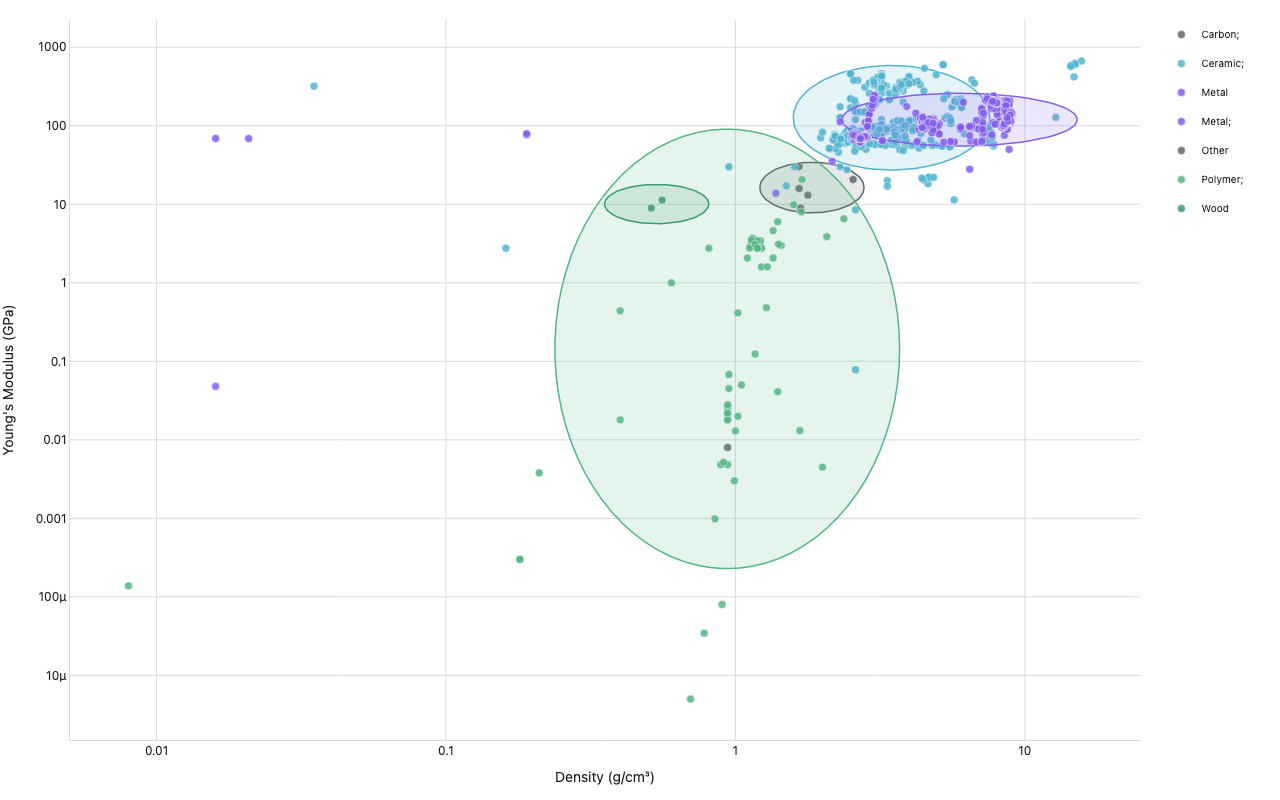
Ashby chart
Materials Science — density vs. Young's modulus, log-log
Example from the compendium of canonical charts
Python Code
"""Materials Science — Ashby chart (density vs. Young's modulus, log-log)."""
from pathlib import Path

# ── Palette + theme (matching the Plotly Studio gallery these charts ship in) ──
VIOLET, TEAL, GREEN, PINK, ORANGE = "#845EEE", "#52B3D0", "#55B685", "#DA5597", "#E9A23B"
PRIMARY, SECONDARY = VIOLET, TEAL
COLORWAY = [VIOLET, TEAL, GREEN, PINK, ORANGE]
BG, TEXT, GRID, MUTED = "#ffffff", "#1c2024", "#d9d9e0", "#60646c"
FONT = "Inter, -apple-system, BlinkMacSystemFont, sans-serif"
COLORSCALE = [[0, "rgba(132, 94, 238, 0.05)"], [1, "rgba(132, 94, 238, 0.9)"]]


def apply_theme(fig):
    """Light gallery theme: white background, Inter font, soft gridlines."""
    fig.update_layout(
        paper_bgcolor=BG, plot_bgcolor=BG, colorway=COLORWAY,
        font=dict(family=FONT, color=TEXT, size=12),
        legend=dict(font=dict(color=TEXT)),
        hoverlabel=dict(bgcolor="#f0f0f3", font=dict(color=TEXT, family=FONT), bordercolor=GRID),
    )
    fig.update_xaxes(gridcolor=GRID, linecolor=GRID, zerolinecolor=GRID)
    fig.update_yaxes(gridcolor=GRID, linecolor=GRID, zerolinecolor=GRID)


def fetch_csv(url, **kwargs):
    import io
    import pandas as pd
    import requests
    r = requests.get(url, timeout=60)
    r.raise_for_status()
    return pd.read_csv(io.StringIO(r.text), **kwargs)


def fetch_json(url):
    import requests
    r = requests.get(url, timeout=60)
    r.raise_for_status()
    return r.json()

import numpy as np
import plotly.graph_objects as go


URL = "https://raw.githubusercontent.com/mrealpe/OpenMaterialsSelector/master/datos.csv"

# Fixed color map for common material families
FAMILY_COLORS = {
    "Metal":      "#845EEE",   # VIOLET
    "Metals":     "#845EEE",
    "Polymer":    "#55B685",   # GREEN
    "Polymers":   "#55B685",
    "Ceramic":    "#52B3D0",   # TEAL
    "Ceramics":   "#52B3D0",
    "Composite":  "#DA5597",   # PINK
    "Composites": "#DA5597",
    "Foam":       "#52B3D0",   # TEAL
    "Foams":      "#52B3D0",
    "Natural":    "#a07fd6",
    "Glass":      "#c87c22",
    "Wood":       "#3d9c6e",
    "Rubber":     "#e06060",
    "Other":      "#60646c",   # MUTED
}


def get_family_color(family_str):
    for key, color in FAMILY_COLORS.items():
        if key.lower() in str(family_str).lower():
            return color
    return FAMILY_COLORS["Other"]


def load_data():
    try:
        df = fetch_csv(URL, encoding="utf-8-sig")
        print(f"  columns: {list(df.columns)}")
        print(f"  shape: {df.shape}")
        return df
    except Exception as e:
        print(f"  primary load failed ({e}), trying latin-1")
        try:
            import io, requests
            r = requests.get(URL, verify=False, timeout=60)
            r.raise_for_status()
            import pandas as pd
            df = pd.read_csv(io.StringIO(r.content.decode("latin-1")))
            print(f"  columns (latin-1): {list(df.columns)}")
            return df
        except Exception as e2:
            print(f"  latin-1 also failed: {e2}")
            return None


def find_col(df, candidates):
    """Find first column name matching any candidate (case-insensitive, partial match)."""
    for cand in candidates:
        for col in df.columns:
            # Strip BOM and whitespace
            clean = col.strip().lstrip("").lower()
            if cand.lower() in clean:
                return col
    return None


def generate():
    import pandas as pd

    df = load_data()

    density_col = None
    modulus_col = None
    category_col = None
    name_col = None

    if df is not None:
        # Strip BOM from all column names
        df.columns = [c.strip().lstrip("") for c in df.columns]
        print(f"  cleaned columns: {list(df.columns)}")

        density_col  = find_col(df, ["density", "densidad", "rho"])
        modulus_col  = find_col(df, ["young", "elastic", "modulus", "modulo", "e (gpa)", "young's"])
        category_col = find_col(df, ["category", "familia", "family", "class", "type"])
        name_col     = find_col(df, ["name", "nombre", "material"])

        print(f"  density_col={density_col}, modulus_col={modulus_col}, "
              f"category_col={category_col}, name_col={name_col}")

    if df is None or density_col is None or modulus_col is None:
        print("  falling back to synthetic Ashby data")
        # Representative data for major material families
        data = {
            "Name": [
                "Mild steel", "Aluminium alloy", "Titanium alloy", "Copper",
                "Cast iron", "Stainless steel",
                "HDPE", "Polypropylene", "Polycarbonate", "Nylon 66", "PTFE",
                "Alumina (Al2O3)", "Silicon carbide", "Borosilicate glass",
                "CFRP (UD)", "GFRP (UD)", "Kevlar composite",
                "Rigid foam (PU)", "Metal foam (Al)",
                "Oak (wood)", "Bamboo",
            ],
            "Category": [
                "Metal", "Metal", "Metal", "Metal", "Metal", "Metal",
                "Polymer", "Polymer", "Polymer", "Polymer", "Polymer",
                "Ceramic", "Ceramic", "Ceramic",
                "Composite", "Composite", "Composite",
                "Foam", "Foam",
                "Natural", "Natural",
            ],
            "Density": [
                7.85, 2.7, 4.5, 8.9, 7.2, 7.9,
                0.95, 0.91, 1.2, 1.14, 2.15,
                3.9, 3.2, 2.23,
                1.6, 2.0, 1.35,
                0.06, 0.3,
                0.6, 0.7,
            ],
            "Modulus": [
                210, 70, 115, 120, 175, 200,
                0.8, 1.5, 2.4, 3.0, 0.5,
                380, 410, 70,
                150, 40, 80,
                0.03, 5,
                12, 20,
            ],
        }
        df = pd.DataFrame(data)
        density_col  = "Density"
        modulus_col  = "Modulus"
        category_col = "Category"
        name_col     = "Name"

    # Clean numeric columns
    df[density_col] = pd.to_numeric(df[density_col], errors="coerce")
    df[modulus_col] = pd.to_numeric(df[modulus_col], errors="coerce")
    df = df.dropna(subset=[density_col, modulus_col])
    df = df[(df[density_col] > 0) & (df[modulus_col] > 0)]
    print(f"  valid rows: {len(df)}")

    # Get category label (first word)
    if category_col:
        df["_family"] = df[category_col].astype(str).str.split().str[0]
    else:
        df["_family"] = "Other"

    def hex_to_rgba(hex_color, alpha):
        h = hex_color.lstrip("#")
        r, g, b = int(h[0:2], 16), int(h[2:4], 16), int(h[4:6], 16)
        return f"rgba({r},{g},{b},{alpha})"

    fig = go.Figure()

    families = df["_family"].unique()
    for fam in sorted(families):
        sub = df[df["_family"] == fam]
        color = get_family_color(fam)

        if len(sub) >= 2:
            # Draw family region as a filled ellipse in log-space
            log_x = np.log10(np.clip(sub[density_col].values, 1e-9, None))
            log_y = np.log10(np.clip(sub[modulus_col].values, 1e-9, None))
            cx, cy = log_x.mean(), log_y.mean()
            rx = max(log_x.std() * 1.8, 0.18)
            ry = max(log_y.std() * 1.8, 0.25)
            t = np.linspace(0, 2 * np.pi, 80)
            ell_x = 10 ** (cx + rx * np.cos(t))
            ell_y = 10 ** (cy + ry * np.sin(t))
            fig.add_trace(go.Scatter(
                x=ell_x, y=ell_y,
                mode="lines",
                fill="toself",
                fillcolor=hex_to_rgba(color, 0.15),
                line=dict(color=color, width=1.5),
                showlegend=False,
                hoverinfo="skip",
                legendgroup=fam,
            ))

        hover = (
            sub[name_col].astype(str)
            if name_col
            else sub.index.astype(str)
        )

        fig.add_trace(go.Scatter(
            x=sub[density_col],
            y=sub[modulus_col],
            mode="markers",
            name=fam,
            legendgroup=fam,
            marker=dict(color=color, size=8, opacity=0.85,
                        line=dict(color="white", width=0.5)),
            text=hover,
            hovertemplate=(
                "<b>%{text}</b><br>"
                "Density: %{x:.2f} g/cm³<br>"
                "Modulus: %{y:.1f} GPa<extra></extra>"
            ),
        ))

    fig.update_layout(
        xaxis=dict(
            title="Density (g/cm³)",
            type="log",
            dtick=1,
            showgrid=True,
        ),
        yaxis=dict(
            title="Young's Modulus (GPa)",
            type="log",
            dtick=1,
            showgrid=True,
        ),
        legend=dict(
            x=1.02, y=1.0,
            xanchor="left",
            font=dict(size=10),
        ),
        margin=dict(t=20, b=60, l=70, r=140),
    )

    apply_theme(fig)
    return fig


fig = generate()
fig.show()
Made with Plotly