
parallel-coordinate plot of Jura geochemical assay data
Mining
Example from the compendium of canonical charts
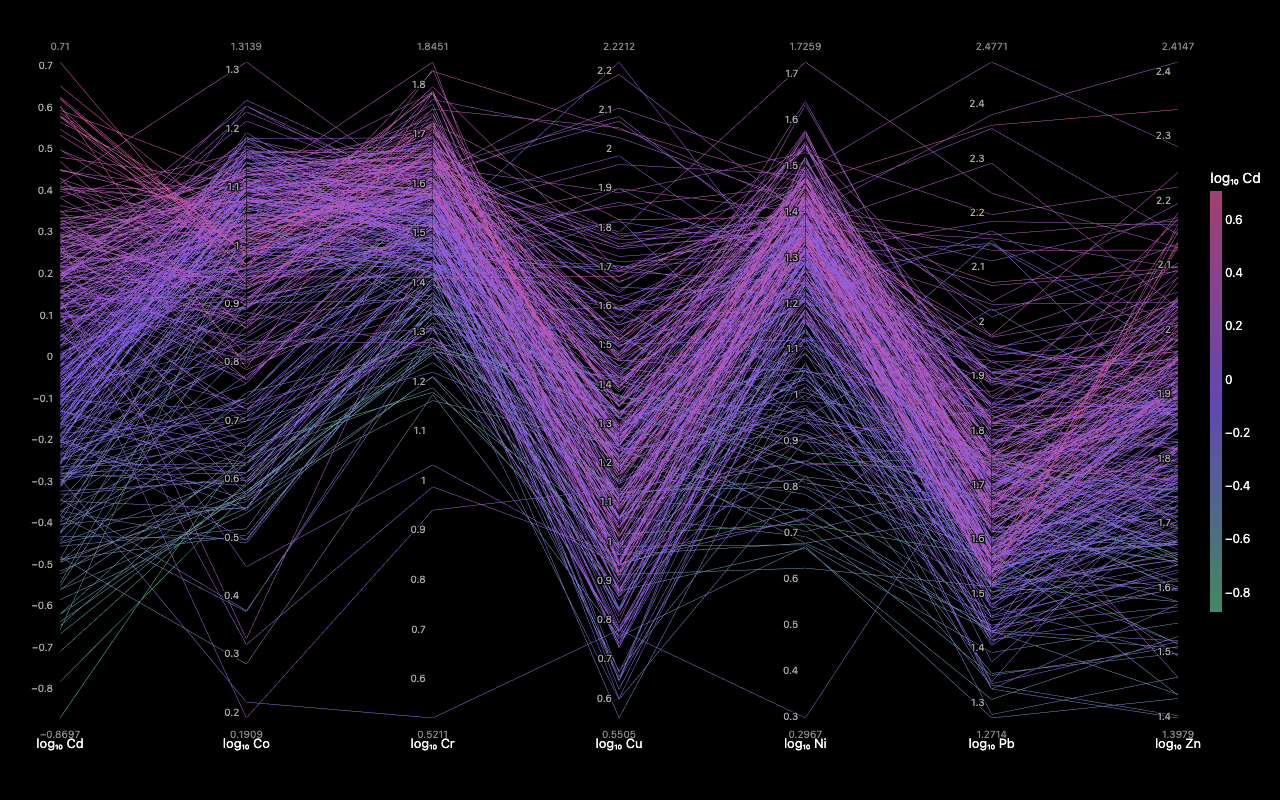
Python Code
"""Mining — parallel-coordinate plot of Jura geochemical assay data."""
import io
from pathlib import Path

# ── Palette + theme (matching the Plotly Studio gallery these charts ship in) ──
VIOLET, TEAL, GREEN, PINK, ORANGE = "#845EEE", "#52B3D0", "#55B685", "#DA5597", "#E9A23B"
PRIMARY, SECONDARY = VIOLET, TEAL
COLORWAY = [VIOLET, TEAL, GREEN, PINK, ORANGE]
BG, TEXT, GRID, MUTED = "#ffffff", "#1c2024", "#d9d9e0", "#60646c"
FONT = "Inter, -apple-system, BlinkMacSystemFont, sans-serif"
COLORSCALE = [[0, "rgba(132, 94, 238, 0.05)"], [1, "rgba(132, 94, 238, 0.9)"]]


def apply_theme(fig):
    """Light gallery theme: white background, Inter font, soft gridlines."""
    fig.update_layout(
        paper_bgcolor=BG, plot_bgcolor=BG, colorway=COLORWAY,
        font=dict(family=FONT, color=TEXT, size=12),
        legend=dict(font=dict(color=TEXT)),
        hoverlabel=dict(bgcolor="#f0f0f3", font=dict(color=TEXT, family=FONT), bordercolor=GRID),
    )
    fig.update_xaxes(gridcolor=GRID, linecolor=GRID, zerolinecolor=GRID)
    fig.update_yaxes(gridcolor=GRID, linecolor=GRID, zerolinecolor=GRID)


def fetch_csv(url, **kwargs):
    import io
    import pandas as pd
    import requests
    r = requests.get(url, timeout=60)
    r.raise_for_status()
    return pd.read_csv(io.StringIO(r.text), **kwargs)


def fetch_json(url):
    import requests
    r = requests.get(url, timeout=60)
    r.raise_for_status()
    return r.json()

import numpy as np
import pandas as pd
import plotly.graph_objects as go

URL = "https://openml.org/data/v1/download/21241898/jura.arff"
METALS = ["Cd", "Co", "Cr", "Cu", "Ni", "Pb", "Zn"]


def parse_arff(text):
    """Parse ARFF format: extract attribute names and data section."""
    lines = text.splitlines()
    attr_names = []
    data_start = None
    for i, line in enumerate(lines):
        stripped = line.strip()
        if stripped.upper().startswith("@ATTRIBUTE"):
            parts = stripped.split()
            attr_names.append(parts[1].strip("'\""))
        elif stripped.upper().startswith("@DATA"):
            data_start = i + 1
            break

    if data_start is None:
        raise ValueError("No @DATA section found")

    data_lines = [l for l in lines[data_start:] if l.strip() and not l.strip().startswith("%")]
    df = pd.read_csv(io.StringIO("\n".join(data_lines)), header=None, names=attr_names)
    return df


def generate():
    try:
        import requests
        print("fetching Jura assay ARFF …")
        r = requests.get(URL, verify=False, timeout=60)
        r.raise_for_status()
        df = parse_arff(r.text)
        print(f"  loaded {len(df)} rows; columns: {list(df.columns)}")

        # Find metal columns (case-insensitive)
        col_map = {c.lower(): c for c in df.columns}
        metals_found = [col_map[m.lower()] for m in METALS if m.lower() in col_map]
        if len(metals_found) < 4:
            raise ValueError(f"Too few metal columns found: {metals_found}")

    except Exception as e:
        print(f"  fetch failed ({e}); using synthetic fallback")
        np.random.seed(11)
        n = 359
        df = pd.DataFrame({
            "Cd": np.random.lognormal(0.3, 0.8, n),
            "Co": np.random.lognormal(2.5, 0.6, n),
            "Cr": np.random.lognormal(4.0, 0.7, n),
            "Cu": np.random.lognormal(3.0, 0.9, n),
            "Ni": np.random.lognormal(3.2, 0.7, n),
            "Pb": np.random.lognormal(4.0, 0.8, n),
            "Zn": np.random.lognormal(5.0, 0.7, n),
        })
        metals_found = METALS

    metal_df = df[metals_found].apply(pd.to_numeric, errors="coerce").dropna()

    # Log10 transform (skewed distributions)
    log_df = np.log10(metal_df.clip(lower=1e-6))

    # Color by Cd (first metal)
    color_vals = log_df[metals_found[0]].values
    cmin, cmax = color_vals.min(), color_vals.max()

    dimensions = []
    for col in metals_found:
        vals = log_df[col].values
        dimensions.append(dict(
            label=f"log₁₀ {col}",
            values=vals,
            range=[vals.min(), vals.max()],
        ))

    fig = go.Figure(go.Parcoords(
        line=dict(
            color=color_vals,
            colorscale=[
                [0, "rgba(85,182,133,0.5)"],
                [0.5, "rgba(132,94,238,0.5)"],
                [1, "rgba(218,85,151,0.5)"],
            ],
            cmin=cmin,
            cmax=cmax,
            showscale=True,
            colorbar=dict(
                title=dict(text=f"log₁₀ {metals_found[0]}"),
                thickness=12,
                len=0.7,
            ),
        ),
        dimensions=dimensions,
        labelangle=0,
        labelside="bottom",
        labelfont=dict(size=13),
    ))

    fig.update_layout(
        margin=dict(t=60, b=80, l=60, r=80),
        height=520,
    )
    apply_theme(fig)
    return fig


fig = generate()
fig.show()
Made with Plotly