
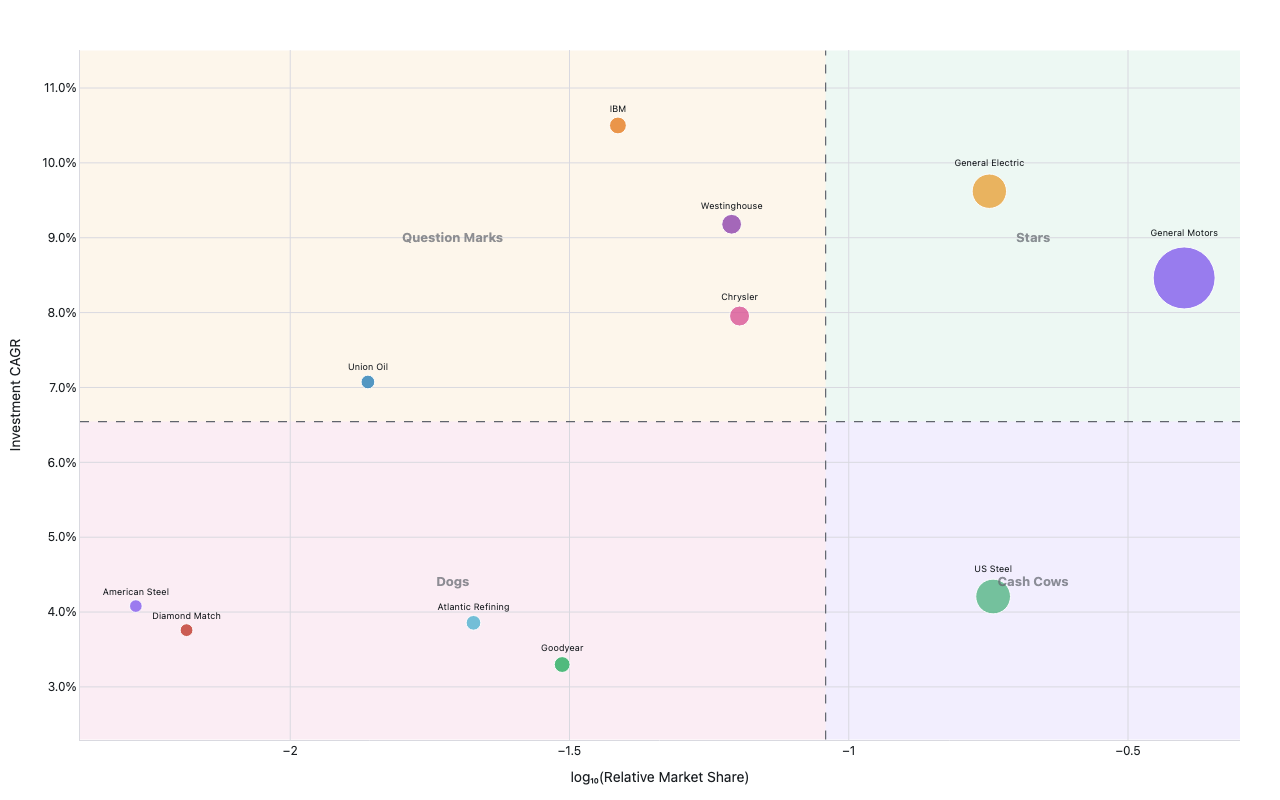
BCG growth-share matrix
Strategy — Grunfeld investment data
Example from the compendium of canonical charts
Python Code
"""Strategy — BCG growth-share matrix (Grunfeld investment data)."""
from pathlib import Path

# ── Palette + theme (matching the Plotly Studio gallery these charts ship in) ──
VIOLET, TEAL, GREEN, PINK, ORANGE = "#845EEE", "#52B3D0", "#55B685", "#DA5597", "#E9A23B"
PRIMARY, SECONDARY = VIOLET, TEAL
COLORWAY = [VIOLET, TEAL, GREEN, PINK, ORANGE]
BG, TEXT, GRID, MUTED = "#ffffff", "#1c2024", "#d9d9e0", "#60646c"
FONT = "Inter, -apple-system, BlinkMacSystemFont, sans-serif"
COLORSCALE = [[0, "rgba(132, 94, 238, 0.05)"], [1, "rgba(132, 94, 238, 0.9)"]]


def apply_theme(fig):
    """Light gallery theme: white background, Inter font, soft gridlines."""
    fig.update_layout(
        paper_bgcolor=BG, plot_bgcolor=BG, colorway=COLORWAY,
        font=dict(family=FONT, color=TEXT, size=12),
        legend=dict(font=dict(color=TEXT)),
        hoverlabel=dict(bgcolor="#f0f0f3", font=dict(color=TEXT, family=FONT), bordercolor=GRID),
    )
    fig.update_xaxes(gridcolor=GRID, linecolor=GRID, zerolinecolor=GRID)
    fig.update_yaxes(gridcolor=GRID, linecolor=GRID, zerolinecolor=GRID)


def fetch_csv(url, **kwargs):
    import io
    import pandas as pd
    import requests
    r = requests.get(url, timeout=60)
    r.raise_for_status()
    return pd.read_csv(io.StringIO(r.text), **kwargs)


def fetch_json(url):
    import requests
    r = requests.get(url, timeout=60)
    r.raise_for_status()
    return r.json()

import numpy as np
import pandas as pd
import plotly.graph_objects as go

URL = "https://vincentarelbundock.github.io/Rdatasets/csv/AER/Grunfeld.csv"
COLORS = [VIOLET, GREEN, ORANGE, PINK, TEAL, "#e67e22", "#2980b9", "#8e44ad", "#27ae60", "#c0392b"]


def generate():
    print("fetching Grunfeld from Rdatasets …")
    df = fetch_csv(URL)
    print("columns:", df.columns.tolist())
    print(df.head(3))

    df.columns = [c.strip().lower() for c in df.columns]
    # Cols: firm, year, value, invest, capital

    # Compute for each firm: mean value, invest CAGR, mean invest
    firms = df["firm"].unique()
    records = []
    for firm in firms:
        sub = df[df["firm"] == firm].sort_values("year")
        mean_val   = sub["value"].mean()
        mean_inv   = sub["invest"].mean()
        y0 = sub["invest"].iloc[0]
        y1 = sub["invest"].iloc[-1]
        n  = len(sub) - 1
        cagr = (y1 / y0) ** (1 / n) - 1 if y0 > 0 and n > 0 else 0.0
        records.append({"firm": firm, "mean_val": mean_val,
                        "mean_inv": mean_inv, "invest_cagr": cagr})

    res = pd.DataFrame(records)
    total_val = res["mean_val"].sum()
    res["rel_share"] = res["mean_val"] / total_val
    res["log_share"] = np.log10(res["rel_share"])

    mean_growth = res["invest_cagr"].mean()
    log_mid = np.log10(1 / len(firms))  # divider at equal share

    # Quadrant labels
    def quadrant(row):
        if row["log_share"] >= log_mid and row["invest_cagr"] >= mean_growth:
            return "Star"
        elif row["log_share"] >= log_mid:
            return "Cash Cow"
        elif row["invest_cagr"] >= mean_growth:
            return "Question Mark"
        else:
            return "Dog"

    res["quadrant"] = res.apply(quadrant, axis=1)

    x_min, x_max = res["log_share"].min() - 0.1, res["log_share"].max() + 0.1
    y_min, y_max = res["invest_cagr"].min() - 0.01, res["invest_cagr"].max() + 0.01

    fig = go.Figure()

    # Quadrant background rectangles
    quad_styles = [
        (log_mid, x_max, mean_growth, y_max, "Stars", "rgba(85,182,133,0.10)"),
        (x_min,   log_mid, mean_growth, y_max, "Question Marks", "rgba(233,162,59,0.10)"),
        (log_mid, x_max, y_min, mean_growth, "Cash Cows", "rgba(132,94,238,0.10)"),
        (x_min,   log_mid, y_min, mean_growth, "Dogs", "rgba(218,85,151,0.10)"),
    ]
    for x0, x1, y0, y1, label, color in quad_styles:
        fig.add_shape(type="rect", x0=x0, x1=x1, y0=y0, y1=y1,
                      fillcolor=color, line=dict(width=0), layer="below")
        fig.add_annotation(x=(x0+x1)/2, y=(y0+y1)/2,
                           text=f"<b>{label}</b>",
                           showarrow=False, font=dict(size=13, color=MUTED),
                           opacity=0.7)

    # Divider lines
    fig.add_shape(type="line", x0=log_mid, x1=log_mid, y0=y_min, y1=y_max,
                  line=dict(color=MUTED, width=1.2, dash="dash"))
    fig.add_shape(type="line", x0=x_min, x1=x_max, y0=mean_growth, y1=mean_growth,
                  line=dict(color=MUTED, width=1.2, dash="dash"))

    # Bubble scatter
    for i, row in res.iterrows():
        fig.add_trace(go.Scatter(
            x=[row["log_share"]],
            y=[row["invest_cagr"]],
            mode="markers+text",
            marker=dict(size=row["mean_val"] / res["mean_val"].max() * 50 + 12,
                        color=COLORS[i % len(COLORS)], opacity=0.8,
                        line=dict(width=1, color="white")),
            text=[str(row["firm"])],
            textposition="top center",
            textfont=dict(size=9),
            name=str(row["firm"]),
            hovertemplate=(f"<b>Firm {row['firm']}</b><br>"
                           f"Rel Share: {row['rel_share']:.2%}<br>"
                           f"Invest CAGR: {row['invest_cagr']:.1%}<extra></extra>"),
        ))

    fig.update_layout(
        xaxis=dict(title="log₁₀(Relative Market Share)", range=[x_min, x_max]),
        yaxis=dict(title="Investment CAGR", tickformat=".1%"),
        showlegend=False,
        margin=dict(t=50, b=60, l=80, r=40),
    )
    apply_theme(fig)
    return fig


fig = generate()
fig.show()
Made with Plotly