
borehole striplog / composite well log
Geology — Kennetcook #2, P-129
Example from the compendium of canonical charts
Python Code
"""Geology — borehole striplog / composite well log (Kennetcook #2, P-129).

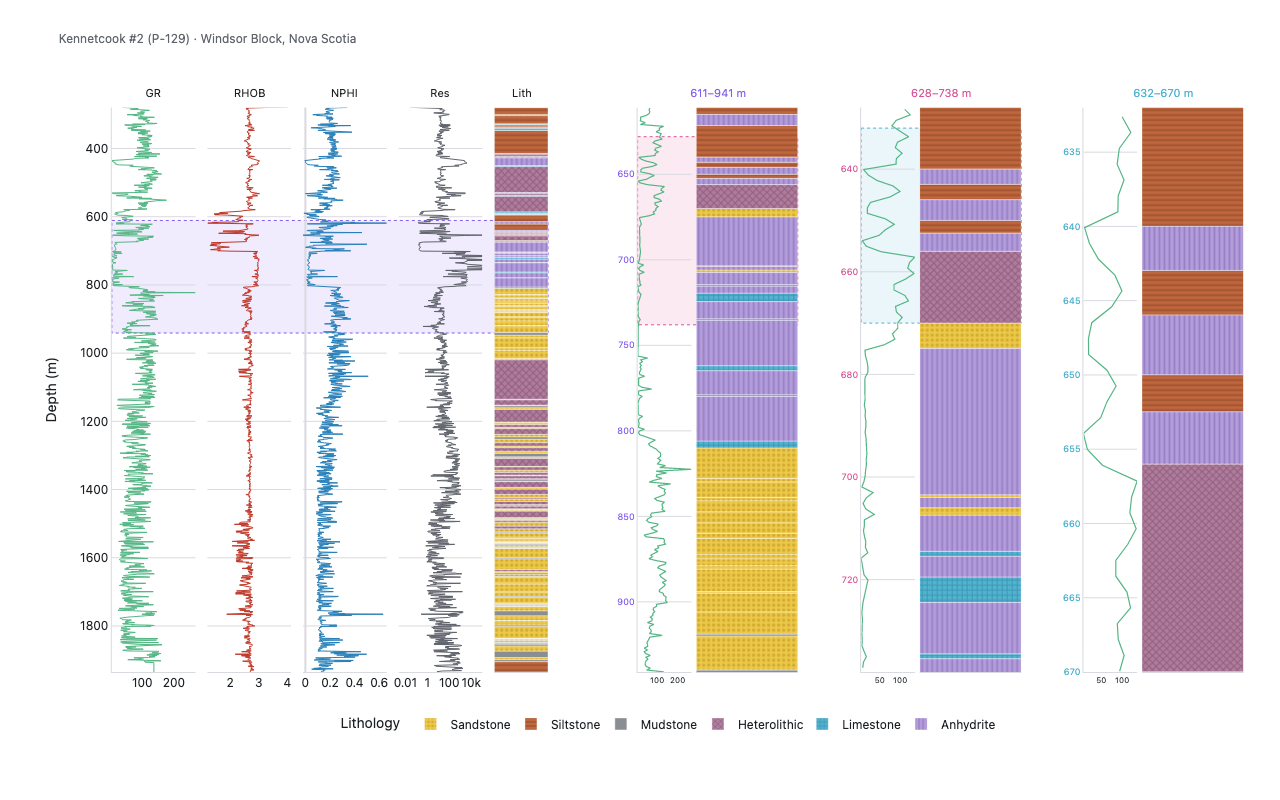
A composite downhole log for one real well: gamma-ray, bulk density, neutron
porosity and deep resistivity curves beside a USGS-patterned lithology column,
all hung on a shared reversed depth axis — plus a PROGRESSIVE ZOOM CASCADE:
three sub-views that each magnify a window *inside* the previous one
(overview → zoom → deeper zoom → deepest), each on its OWN depth axis.
Correlation lines chain between adjacent panels using plotly.js 3.4.0
multi-axis shape references (`yref: ['y', 'y2']`, then `['y2','y3']`, …,
PR #7666): pan any panel's depth axis and its links track, the way a geologist
nudges one log against another to line a marker up.

Data: the Kennetcook #2 (P-129) well, Windsor Block, Nova Scotia — the
canonical teaching well shipped with Agile's `striplog` library. Wireline
curves come from the PETREL LAS export; the lithology column is the digitized
striplog. The multi-axis connectors live only in the interactive JSON; the
static PNG (kaleido bundles an older plotly.js) shows the tracks without them.
"""
import json
import os
import tempfile
from pathlib import Path

# ── Palette + theme (matching the Plotly Studio gallery these charts ship in) ──
VIOLET, TEAL, GREEN, PINK, ORANGE = "#845EEE", "#52B3D0", "#55B685", "#DA5597", "#E9A23B"
PRIMARY, SECONDARY = VIOLET, TEAL
COLORWAY = [VIOLET, TEAL, GREEN, PINK, ORANGE]
BG, TEXT, GRID, MUTED = "#ffffff", "#1c2024", "#d9d9e0", "#60646c"
FONT = "Inter, -apple-system, BlinkMacSystemFont, sans-serif"
COLORSCALE = [[0, "rgba(132, 94, 238, 0.05)"], [1, "rgba(132, 94, 238, 0.9)"]]


def apply_theme(fig):
    """Light gallery theme: white background, Inter font, soft gridlines."""
    fig.update_layout(
        paper_bgcolor=BG, plot_bgcolor=BG, colorway=COLORWAY,
        font=dict(family=FONT, color=TEXT, size=12),
        legend=dict(font=dict(color=TEXT)),
        hoverlabel=dict(bgcolor="#f0f0f3", font=dict(color=TEXT, family=FONT), bordercolor=GRID),
    )
    fig.update_xaxes(gridcolor=GRID, linecolor=GRID, zerolinecolor=GRID)
    fig.update_yaxes(gridcolor=GRID, linecolor=GRID, zerolinecolor=GRID)


def fetch_csv(url, **kwargs):
    import io
    import pandas as pd
    import requests
    r = requests.get(url, timeout=60)
    r.raise_for_status()
    return pd.read_csv(io.StringIO(r.text), **kwargs)


def fetch_json(url):
    import requests
    r = requests.get(url, timeout=60)
    r.raise_for_status()
    return r.json()

import numpy as np
import pandas as pd
import plotly.graph_objects as go

BASE = "https://raw.githubusercontent.com/agilescientific/striplog/main/docs/tutorial/"
LAS_URL = BASE + "P-129_out.LAS"
LITH_URL = BASE + "P-129_striplog_from_image.las"
NULL_VAL = -999.25
DECIMATE = 1600

# Depth span (m) of each zoom level — each nested inside the previous one.
ZOOM_WIDTHS = (330.0, 110.0, 38.0)
ZOOM_ACCENTS = [VIOLET, PINK, TEAL]   # one accent per zoom level

# Lithology classes → (fill colour, plotly pattern shape, pattern line colour).
# Colours/patterns approximate the FGDC/USGS lithology convention within the
# limited set of fills plotly offers (dots ≈ sandstone, brick-grid ≈ limestone,
# dashes ≈ mudstone/siltstone, hatch ≈ anhydrite).
LITHOLOGY = {
    "Siltstone":    ("#c0673e", "-",  "#7d3f23"),
    "Sandstone":    ("#edc949", ".",  "#b8901f"),
    "Limestone":    ("#52b3d0", "+",  "#2c7d96"),
    "Mudstone":     ("#8a8d93", "",   "#5a5d63"),
    "Heterolithic": ("#b07c9e", "x",  "#754a63"),
    "Anhydrite":    ("#b39ddb", "|",  "#7e63b0"),
}
LEGEND_ORDER = ["Sandstone", "Siltstone", "Mudstone",
                "Heterolithic", "Limestone", "Anhydrite"]


def classify(desc: str) -> str:
    d = desc.lower()
    if "anhydrite" in d:
        return "Anhydrite"
    if "limestone" in d:
        return "Limestone"
    if "heterolithic" in d:
        return "Heterolithic"
    if "mudstone" in d:
        return "Mudstone"
    if "sandstone" in d:
        return "Sandstone"
    return "Siltstone"


def load_curves() -> pd.DataFrame:
    import requests
    import lasio
    r = requests.get(LAS_URL, verify=False, timeout=90)
    r.raise_for_status()
    with tempfile.NamedTemporaryFile(suffix=".las", delete=False) as f:
        f.write(r.content)
        tmp = f.name
    try:
        las = lasio.read(tmp, engine="normal")  # the export is WRAP=YES
        df = las.df().reset_index()
        df.columns = [c.strip().upper() for c in df.columns]
        df.replace(NULL_VAL, np.nan, inplace=True)
        return df
    finally:
        os.unlink(tmp)


def load_lithology() -> pd.DataFrame:
    import requests
    r = requests.get(LITH_URL, verify=False, timeout=60)
    r.raise_for_status()
    lines = r.text.replace("\r", "\n").split("\n")
    start = next(i for i, l in enumerate(lines) if l.startswith("~Lithology_Data"))
    rows = []
    for line in lines[start + 1:]:
        line = line.strip()
        if not line or line.startswith("~") or line.startswith("#"):
            continue
        top, base, desc = (x.strip() for x in line.split(",", 2))
        rows.append((float(top), float(base), desc.strip().strip('"')))
    return pd.DataFrame(rows, columns=["top", "base", "description"])


def pick_nested(lith, d_top, d_base, widths=ZOOM_WIDTHS):
    """Choose progressively nested windows: each level scans *within* the
    previous window for the placement with the most lithologic variety, so
    window 1 ⊃ window 2 ⊃ window 3 (a telescoping zoom)."""
    windows = []
    lo, hi = d_top, d_base
    for w in widths:
        if hi - lo <= w:
            best = (round(lo), round(hi))
        else:
            best, best_score = (lo, lo + w), (-1, -1)
            step = max(4.0, (hi - lo - w) / 40)
            for start in np.arange(lo, hi - w + 0.1, step):
                end = start + w
                sel = lith[(lith["base"] > start) & (lith["top"] < end)]
                score = (sel["litho"].nunique(), len(sel))
                if score > best_score:
                    best_score, best = score, (round(start), round(end))
        windows.append(best)
        lo, hi = best          # next level nests inside this window
    return windows


def generate():
    try:
        print("fetching P-129 wireline LAS …")
        cv = load_curves()
        dcol = next(c for c in cv.columns if c in ("DEPT", "DEPTH", "MD"))
        step = max(1, len(cv) // DECIMATE)
        cv = cv.iloc[::step].copy()
        print(f"  curves: {len(cv)} rows, {cv[dcol].min():.0f}–{cv[dcol].max():.0f} m")
        print("fetching P-129 lithology striplog …")
        lith = load_lithology()
        lith["litho"] = lith["description"].map(classify)
        print(f"  lithology: {len(lith)} beds, classes {sorted(lith.litho.unique())}")
    except Exception as e:
        print(f"  fetch failed ({e}); aborting (no synthetic fallback for composite log)")
        raise

    depth = cv[dcol]
    d_top, d_base = 280.0, 1935.0
    windows = pick_nested(lith, d_top, d_base)
    print(f"  nested zoom windows: {windows}")

    def col(name):
        return cv[name] if name in cv.columns else pd.Series(np.nan, index=cv.index)

    fig = go.Figure()

    # ── Curve tracks (overview), all anchored to the shared depth axis y ────
    def curve(values, axis, color, name):
        fig.add_trace(go.Scatter(
            x=values, y=depth, mode="lines", line=dict(color=color, width=1.0),
            name=name, xaxis=axis, yaxis="y", showlegend=False,
            hovertemplate="%{x:.2f}<br>%{y:.1f} m<extra>" + name + "</extra>",
        ))

    curve(col("GR"), "x", GREEN, "GR (gAPI)")
    curve(col("RHOB"), "x2", "#c0392b", "RHOB (g/cc)")
    curve(col("NPHI_SAN"), "x3", "#2980b9", "NPHI (v/v)")
    curve(col("RT_HRLT"), "x4", MUTED, "Resistivity (Ω·m)")

    # ── Lithology column — reused for the overview and each zoom panel ──────
    def lith_bars(xaxis, yaxis, showlegend):
        for name in LEGEND_ORDER:
            sub = lith[lith["litho"] == name]
            if sub.empty:
                continue
            color, shape, fg = LITHOLOGY[name]
            mids = (sub["top"] + sub["base"]) / 2
            fig.add_trace(go.Bar(
                x=[1.0] * len(sub), y=mids, width=(sub["base"] - sub["top"]),
                base=0, orientation="h",
                marker=dict(
                    color=color, line=dict(color="#ffffff", width=0.4),
                    pattern=dict(shape=shape, fgcolor=fg, size=5, solidity=0.35),
                ),
                name=name, legendgroup=name, showlegend=showlegend,
                xaxis=xaxis, yaxis=yaxis,
                customdata=np.stack([sub["top"], sub["base"], sub["description"]], axis=-1),
                hovertemplate=("<b>%{customdata[2]}</b><br>"
                               "%{customdata[0]:.1f}–%{customdata[1]:.1f} m"
                               "<extra>" + name + "</extra>"),
            ))

    lith_bars("x5", "y", True)

    # ── Layout scaffolding ──────────────────────────────────────────────────
    def xax(domain, anchor, **kw):
        return dict(domain=domain, anchor=anchor, showgrid=False, **kw)

    OV_R = 0.40   # right edge of the overview lithology strip (connector source)
    axes = dict(
        xaxis=xax([0.035, 0.105], "y"),
        xaxis2=xax([0.115, 0.185], "y"),
        xaxis3=xax([0.195, 0.265], "y"),
        xaxis4=xax([0.275, 0.345], "y", type="log"),
        xaxis5=xax([0.355, OV_R], "y", range=[0, 1], showticklabels=False, zeroline=False),
        yaxis=dict(domain=[0.10, 0.93], range=[d_base, d_top], autorange=False,
                   title="Depth (m)", gridcolor=GRID, anchor="x"),
    )

    annotations = [
        dict(text=t, x=x, y=0.965, xref="paper", yref="paper", showarrow=False,
             font=dict(size=11, color=TEXT), xanchor="center")
        for t, x in [("GR", 0.07), ("RHOB", 0.15), ("NPHI", 0.23),
                     ("Res", 0.31), ("Lith", 0.378)]
    ]
    annotations.append(dict(
        text="Kennetcook #2 (P-129) · Windsor Block, Nova Scotia",
        x=0.0, y=1.045, xref="paper", yref="paper", showarrow=False,
        xanchor="left", font=dict(size=12, color=MUTED)))

    shapes = []          # single-axis (render in PNG)
    connectors = []      # multi-axis (injected into JSON only)

    # Panel x-domains: three slots across [0.44, 1.0], each GR + lithology.
    Z0, ZSPAN = 0.44, 0.56
    slot = ZSPAN / 3
    panels = []
    for i in range(3):
        s = Z0 + i * slot
        panels.append(([round(s + 0.035, 3), round(s + 0.080, 3)],    # GR domain
                       [round(s + 0.084, 3), round(s + 0.169, 3)]))    # Lith domain

    # ── Progressive zoom cascade: panel i magnifies window i, which is nested
    #    inside window i-1 (the overview is the parent of panel 0) ───────────
    for i, (wt, wb) in enumerate(windows):
        accent = ZOOM_ACCENTS[i]
        yax = f"y{i + 2}"                 # trace refs: y2, y3, y4
        gr_ax = f"x{6 + 2 * i}"           # trace refs: x6, x8, x10
        li_ax = f"x{7 + 2 * i}"           # trace refs: x7, x9, x11
        gr_key = f"xaxis{6 + 2 * i}"      # layout keys: xaxis6, xaxis8, xaxis10
        li_key = f"xaxis{7 + 2 * i}"      # layout keys: xaxis7, xaxis9, xaxis11
        gr_dom, li_dom = panels[i]

        # Parent panel (where this window is highlighted + where its connector
        # starts): the overview for panel 0, otherwise the previous panel.
        parent_y = "y" if i == 0 else f"y{i + 1}"
        parent_right = OV_R if i == 0 else panels[i - 1][1][1]
        parent_xspan = (0.035, OV_R) if i == 0 else (panels[i - 1][0][0], panels[i - 1][1][1])

        # Highlight band marking this window, drawn on the PARENT's depth axis
        # (single y-axis → shows in the static PNG too).
        shapes.append(dict(
            type="rect", xref="paper", yref=parent_y,
            x0=parent_xspan[0], x1=parent_xspan[1], y0=wt, y1=wb,
            fillcolor=_rgba(accent, 0.12), line=dict(color=accent, width=1, dash="dot"),
            layer="below"))

        # This panel's own independent (reversed) depth axis.
        axes[f"yaxis{i + 2}"] = dict(
            domain=[0.10, 0.93], range=[wb, wt], autorange=False,
            gridcolor=GRID, anchor=gr_ax, side="left",
            tickfont=dict(size=9), color=accent)
        axes[gr_key] = xax(gr_dom, yax, tickfont=dict(size=8))
        axes[li_key] = xax(li_dom, yax, range=[0, 1], showticklabels=False, zeroline=False)

        # Zoom traces.
        zmask = (depth >= wt) & (depth <= wb)
        fig.add_trace(go.Scatter(
            x=col("GR")[zmask], y=depth[zmask], mode="lines",
            line=dict(color=GREEN, width=1.2), name=f"GR zoom {i+1}",
            xaxis=gr_ax, yaxis=yax, showlegend=False,
            hovertemplate="%{x:.1f} gAPI<br>%{y:.1f} m<extra>GR</extra>"))
        lith_bars(li_ax, yax, False)

        # Panel heading.
        annotations.append(dict(
            text=f"{wt:.0f}–{wb:.0f} m", x=(gr_dom[0] + li_dom[1]) / 2, y=0.965,
            xref="paper", yref="paper", showarrow=False, xanchor="center",
            font=dict(size=11, color=accent)))

        # Multi-axis correlation lines chaining parent → this panel: window
        # edges on the parent axis to the top/base of this panel's axis.
        for d in (wt, wb):
            connectors.append(dict(
                type="line", xref="paper", yref=[parent_y, yax],
                x0=parent_right, x1=gr_dom[0], y0=d, y1=d,
                line=dict(color=accent, width=1.1, dash="dot")))

    fig.update_layout(
        barmode="overlay", bargap=0,
        annotations=annotations, shapes=shapes,
        legend=dict(orientation="h", x=0.5, xanchor="center", y=0.045,
                    yanchor="top", title=dict(text="Lithology  ")),
        margin=dict(t=60, b=60, l=70, r=15),
        height=800, **axes,
    )

    apply_theme(fig)
    fig.update_layout(title_text=None)

    # Static PNG — kaleido's bundled plotly.js predates multi-axis shapes, so
    # it gets the tracks + highlight bands only.

    # Interactive JSON — inject the multi-axis correlation lines.
    doc = json.loads(fig.to_json())
    doc["layout"].setdefault("shapes", [])
    doc["layout"]["shapes"].extend(connectors)


def _rgba(hex_color, alpha):
    h = hex_color.lstrip("#")
    r, g, b = (int(h[i:i + 2], 16) for i in (0, 2, 4))
    return f"rgba({r},{g},{b},{alpha})"


    return fig

fig = generate()
fig.show()
Made with Plotly