
Callan quilt / periodic table of returns
Asset Allocation
Example from the compendium of canonical charts
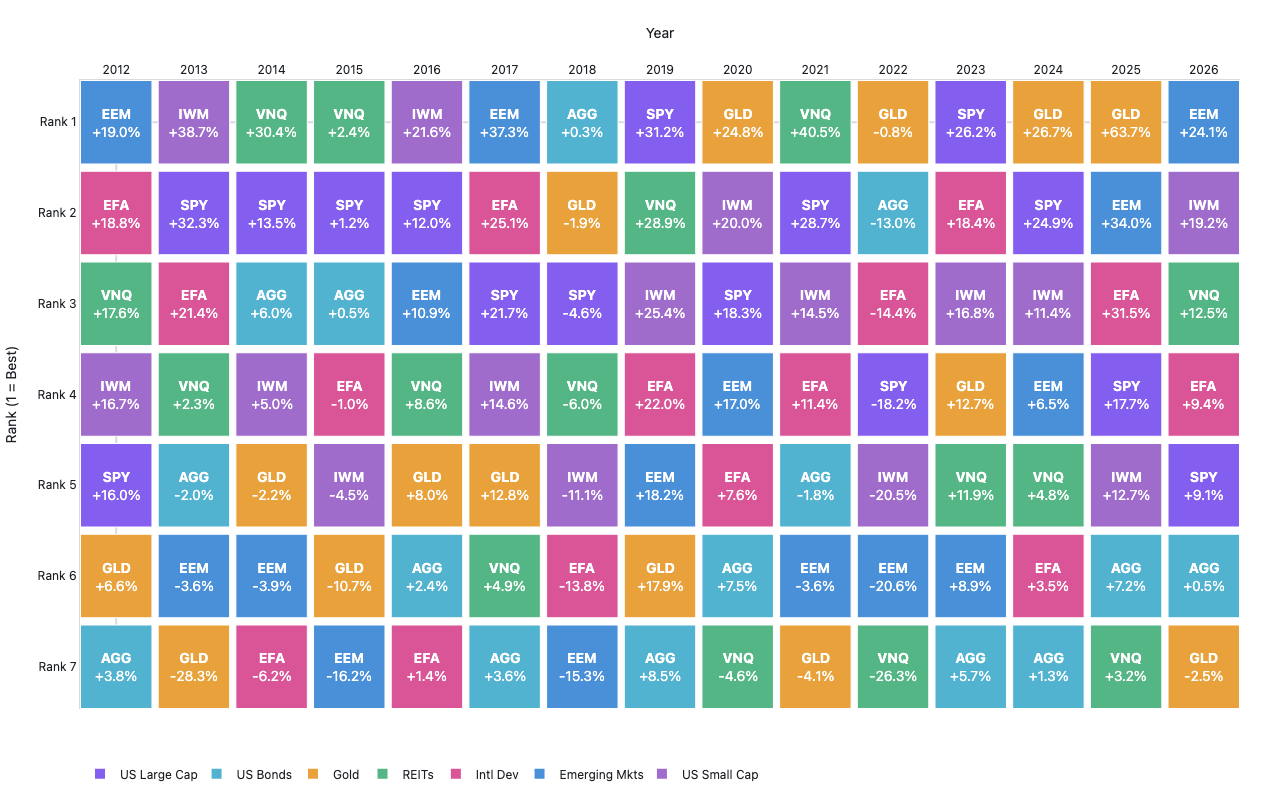
Python Code
"""Asset Allocation — Callan quilt / periodic table of returns."""
from pathlib import Path

# ── Palette + theme (matching the Plotly Studio gallery these charts ship in) ──
VIOLET, TEAL, GREEN, PINK, ORANGE = "#845EEE", "#52B3D0", "#55B685", "#DA5597", "#E9A23B"
PRIMARY, SECONDARY = VIOLET, TEAL
COLORWAY = [VIOLET, TEAL, GREEN, PINK, ORANGE]
BG, TEXT, GRID, MUTED = "#ffffff", "#1c2024", "#d9d9e0", "#60646c"
FONT = "Inter, -apple-system, BlinkMacSystemFont, sans-serif"
COLORSCALE = [[0, "rgba(132, 94, 238, 0.05)"], [1, "rgba(132, 94, 238, 0.9)"]]


def apply_theme(fig):
    """Light gallery theme: white background, Inter font, soft gridlines."""
    fig.update_layout(
        paper_bgcolor=BG, plot_bgcolor=BG, colorway=COLORWAY,
        font=dict(family=FONT, color=TEXT, size=12),
        legend=dict(font=dict(color=TEXT)),
        hoverlabel=dict(bgcolor="#f0f0f3", font=dict(color=TEXT, family=FONT), bordercolor=GRID),
    )
    fig.update_xaxes(gridcolor=GRID, linecolor=GRID, zerolinecolor=GRID)
    fig.update_yaxes(gridcolor=GRID, linecolor=GRID, zerolinecolor=GRID)


def fetch_csv(url, **kwargs):
    import io
    import pandas as pd
    import requests
    r = requests.get(url, timeout=60)
    r.raise_for_status()
    return pd.read_csv(io.StringIO(r.text), **kwargs)


def fetch_json(url):
    import requests
    r = requests.get(url, timeout=60)
    r.raise_for_status()
    return r.json()

import numpy as np
import pandas as pd
import plotly.graph_objects as go
import yfinance as yf
import warnings

warnings.filterwarnings("ignore")

TICKERS = ["SPY", "AGG", "GLD", "VNQ", "EFA", "EEM", "IWM"]
LABELS = {"SPY": "US Large Cap", "AGG": "US Bonds", "GLD": "Gold",
          "VNQ": "REITs", "EFA": "Intl Dev", "EEM": "Emerging Mkts", "IWM": "US Small Cap"}


def generate():
    print("downloading 15-year annual closes from yfinance …")
    raw = yf.download(TICKERS, period="15y", auto_adjust=True, progress=False)["Close"]
    annual = raw.resample("A").last().pct_change().dropna()

    years = [str(y.year) for y in annual.index]
    tickers = annual.columns.tolist()

    # Build rank matrix: for each year, sort tickers by return (best=rank 0=top)
    n_years = len(years)
    n_assets = len(tickers)

    # Color each cell by asset class, not by return value
    ASSET_COLORS = {
        "SPY": "#845EEE",  # violet — US Large Cap
        "AGG": "#52B3D0",  # teal   — US Bonds
        "GLD": "#E9A23B",  # orange — Gold
        "VNQ": "#55B685",  # green  — REITs
        "EFA": "#DA5597",  # pink   — Intl Dev
        "EEM": "#4A90D9",  # blue   — Emerging Mkts
        "IWM": "#A06CCC",  # purple — US Small Cap
    }

    z_idx = np.full((n_assets, n_years), 0.0)  # ticker index for colorscale
    text_vals = [[""] * n_years for _ in range(n_assets)]
    hover_text = [[""] * n_years for _ in range(n_assets)]
    cell_colors = [[None] * n_years for _ in range(n_assets)]

    ticker_to_idx = {t: i for i, t in enumerate(tickers)}

    for j, yr in enumerate(annual.index):
        row = annual.loc[yr]
        ranked = row.sort_values(ascending=False)
        for rank, ticker in enumerate(ranked.index):
            ret = ranked[ticker]
            label = LABELS.get(ticker, ticker)
            text_vals[rank][j] = f"<b>{label}</b><br>{ret:+.1%}"
            hover_text[rank][j] = f"{label}: {ret:+.1%}"
            cell_colors[rank][j] = ASSET_COLORS.get(ticker, "#cccccc")

    # Build a figure using rectangles (one per cell) for full color control
    fig = go.Figure()

    cell_w = 0.9 / n_years if n_years > 0 else 0.1
    cell_h = 0.9 / n_assets if n_assets > 0 else 0.1

    for j, yr in enumerate(years):
        row = annual.loc[annual.index[j]]
        ranked = row.sort_values(ascending=False)
        for rank, ticker in enumerate(ranked.index):
            ret = ranked[ticker]
            label = LABELS.get(ticker, ticker)
            color = ASSET_COLORS.get(ticker, "#cccccc")
            fig.add_shape(
                type="rect",
                x0=j - 0.46, x1=j + 0.46,
                y0=rank - 0.46, y1=rank + 0.46,
                fillcolor=color,
                line_width=1,
                line_color="white",
            )
            fig.add_annotation(
                x=j, y=rank,
                text=f"<b>{ticker}</b><br>{ret:+.1%}",
                showarrow=False,
                font=dict(size=14, color="white"),
                xanchor="center", yanchor="middle",
            )

    # Add a legend via dummy invisible scatter traces
    for ticker, color in ASSET_COLORS.items():
        if ticker in tickers:
            fig.add_trace(go.Scatter(
                x=[None], y=[None], mode="markers",
                marker=dict(size=10, color=color, symbol="square"),
                name=LABELS.get(ticker, ticker),
                showlegend=True,
            ))

    fig.update_layout(
        xaxis=dict(
            title="Year", side="top",
            tickvals=list(range(n_years)),
            ticktext=years,
            showgrid=False,
        ),
        yaxis=dict(
            title="Rank (1 = Best)",
            tickvals=list(range(n_assets)),
            ticktext=[f"Rank {i+1}" for i in range(n_assets)],
            autorange="reversed",
            showgrid=False,
        ),
        legend=dict(orientation="h", y=-0.08, x=0),
        margin=dict(t=80, b=80, l=80, r=40),
    )
    apply_theme(fig)
    return fig


fig = generate()
fig.show()
Made with Plotly