
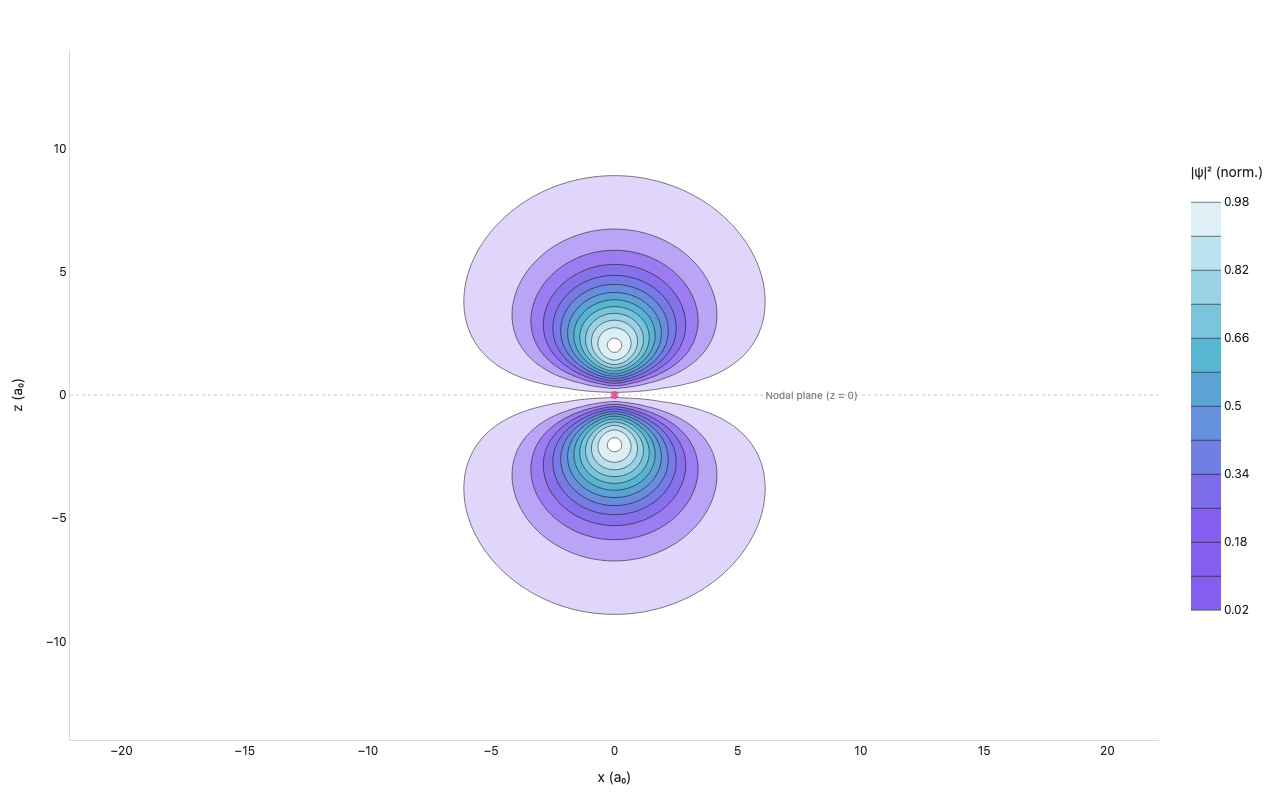
Hydrogen 2p orbital probability density
Quantum Mechanics — contour
Example from the compendium of canonical charts
Python Code
"""Quantum Mechanics — Hydrogen 2p orbital probability density (contour)."""
from pathlib import Path

# ── Palette + theme (matching the Plotly Studio gallery these charts ship in) ──
VIOLET, TEAL, GREEN, PINK, ORANGE = "#845EEE", "#52B3D0", "#55B685", "#DA5597", "#E9A23B"
PRIMARY, SECONDARY = VIOLET, TEAL
COLORWAY = [VIOLET, TEAL, GREEN, PINK, ORANGE]
BG, TEXT, GRID, MUTED = "#ffffff", "#1c2024", "#d9d9e0", "#60646c"
FONT = "Inter, -apple-system, BlinkMacSystemFont, sans-serif"
COLORSCALE = [[0, "rgba(132, 94, 238, 0.05)"], [1, "rgba(132, 94, 238, 0.9)"]]


def apply_theme(fig):
    """Light gallery theme: white background, Inter font, soft gridlines."""
    fig.update_layout(
        paper_bgcolor=BG, plot_bgcolor=BG, colorway=COLORWAY,
        font=dict(family=FONT, color=TEXT, size=12),
        legend=dict(font=dict(color=TEXT)),
        hoverlabel=dict(bgcolor="#f0f0f3", font=dict(color=TEXT, family=FONT), bordercolor=GRID),
    )
    fig.update_xaxes(gridcolor=GRID, linecolor=GRID, zerolinecolor=GRID)
    fig.update_yaxes(gridcolor=GRID, linecolor=GRID, zerolinecolor=GRID)


def fetch_csv(url, **kwargs):
    import io
    import pandas as pd
    import requests
    r = requests.get(url, timeout=60)
    r.raise_for_status()
    return pd.read_csv(io.StringIO(r.text), **kwargs)


def fetch_json(url):
    import requests
    r = requests.get(url, timeout=60)
    r.raise_for_status()
    return r.json()

import numpy as np
import plotly.graph_objects as go


# |ψ_{2,1,0}|² = (1/32π) * (1/a₀)³ * (r/a₀)² * e^{−r/a₀} * cos²θ
# In the xz-plane (y=0):  r = √(x²+z²), cosθ = z/r
# Bohr radius a₀ = 1 (atomic units)


def generate():
    print("computing hydrogen 2pz orbital density in xz-plane …")

    a0 = 1.0  # atomic units
    grid = np.linspace(-14, 14, 150)
    X, Z = np.meshgrid(grid, grid)
    r = np.sqrt(X**2 + Z**2) + 1e-10  # avoid div-by-zero

    cos_theta = Z / r

    # Radial × angular parts of |ψ_{2,1,0}|²
    C = 1 / (32 * np.pi * a0**3)
    psi2 = C * (r / a0)**2 * np.exp(-r / a0) * cos_theta**2

    # Normalize so max = 1 for visual clarity
    psi2 /= psi2.max()

    colorscale = [
        [0.0,   "rgba(255,255,255,0)"],
        [0.05,  "rgba(132,94,238,0.2)"],
        [0.25,  "rgba(132,94,238,0.6)"],
        [0.6,   "rgba(82,179,208,0.9)"],
        [1.0,   "rgba(255,255,255,1.0)"],
    ]

    fig = go.Figure()

    fig.add_trace(go.Contour(
        x=grid,
        y=grid,
        z=psi2,
        colorscale=colorscale,
        contours=dict(
            start=0.02,
            end=1.0,
            size=0.08,
            showlabels=False,
        ),
        colorbar=dict(title="|ψ|² (norm.)", len=0.7),
        hovertemplate="x=%{x:.1f} a₀<br>z=%{y:.1f} a₀<br>|ψ|²=%{z:.3f}<extra></extra>",
        name="|ψ_{2p_z}|²",
        line=dict(width=0.5),
    ))

    # Nucleus marker
    fig.add_trace(go.Scatter(
        x=[0], y=[0],
        mode="markers",
        marker=dict(color="#DA5597", size=8, symbol="circle"),
        name="Nucleus",
        hovertemplate="Nucleus<extra></extra>",
    ))

    # Nodal plane annotation
    fig.add_annotation(
        x=8, y=0,
        text="Nodal plane (z = 0)",
        showarrow=False,
        font=dict(size=10, color="#888"),
    )
    fig.add_hline(y=0, line=dict(color="#ccc", width=1, dash="dot"))

    fig.update_layout(
        xaxis=dict(
            title="x (a₀)",
            scaleanchor="y",
            showgrid=False,
            zeroline=False,
        ),
        yaxis=dict(
            title="z (a₀)",
            showgrid=False,
            zeroline=False,
        ),
        legend=dict(orientation="h", y=1.05),
        margin=dict(t=50, b=60, l=70, r=80),
        height=560,
    )
    apply_theme(fig)
    return fig


fig = generate()
fig.show()
Made with Plotly