
Correlation matrix: two-level labels, banded scale, lower triangle
Portfolio
Example from the compendium of canonical charts
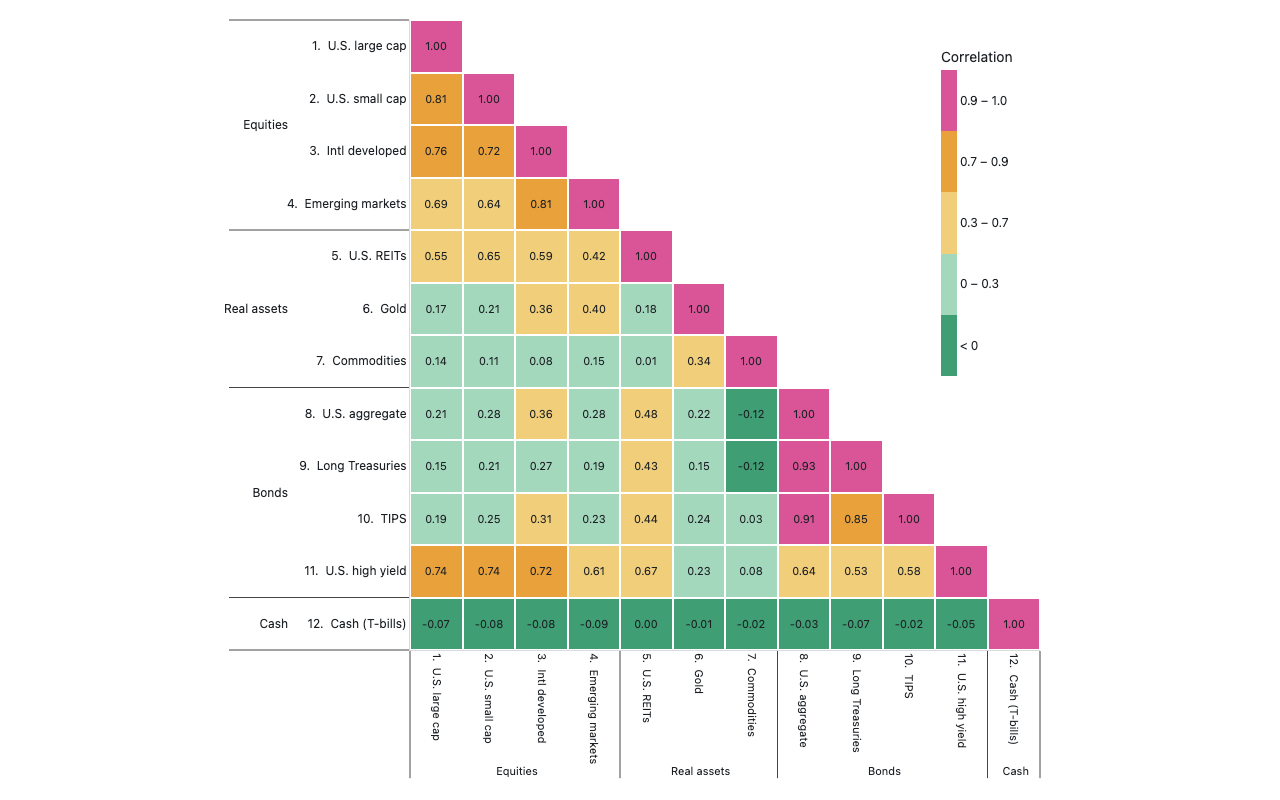
Python Code
"""Portfolio — Correlation matrix: two-level labels, banded scale, lower triangle."""
from pathlib import Path

# ── Palette + theme (matching the Plotly Studio gallery these charts ship in) ──
VIOLET, TEAL, GREEN, PINK, ORANGE = "#845EEE", "#52B3D0", "#55B685", "#DA5597", "#E9A23B"
PRIMARY, SECONDARY = VIOLET, TEAL
COLORWAY = [VIOLET, TEAL, GREEN, PINK, ORANGE]
BG, TEXT, GRID, MUTED = "#ffffff", "#1c2024", "#d9d9e0", "#60646c"
FONT = "Inter, -apple-system, BlinkMacSystemFont, sans-serif"
COLORSCALE = [[0, "rgba(132, 94, 238, 0.05)"], [1, "rgba(132, 94, 238, 0.9)"]]


def apply_theme(fig):
    """Light gallery theme: white background, Inter font, soft gridlines."""
    fig.update_layout(
        paper_bgcolor=BG, plot_bgcolor=BG, colorway=COLORWAY,
        font=dict(family=FONT, color=TEXT, size=12),
        legend=dict(font=dict(color=TEXT)),
        hoverlabel=dict(bgcolor="#f0f0f3", font=dict(color=TEXT, family=FONT), bordercolor=GRID),
    )
    fig.update_xaxes(gridcolor=GRID, linecolor=GRID, zerolinecolor=GRID)
    fig.update_yaxes(gridcolor=GRID, linecolor=GRID, zerolinecolor=GRID)


def fetch_csv(url, **kwargs):
    import io
    import pandas as pd
    import requests
    r = requests.get(url, timeout=60)
    r.raise_for_status()
    return pd.read_csv(io.StringIO(r.text), **kwargs)


def fetch_json(url):
    import requests
    r = requests.get(url, timeout=60)
    r.raise_for_status()
    return r.json()

import numpy as np
import pandas as pd
import plotly.graph_objects as go
import warnings
warnings.filterwarnings("ignore")


# Ordered so each asset class is a contiguous block — the blocks become the
# visible squares of high within-class correlation on the diagonal.
#   (ticker, asset class, asset name)
ASSETS = [
    ("SPY", "Equities",    "U.S. large cap"),
    ("IWM", "Equities",    "U.S. small cap"),
    ("EFA", "Equities",    "Intl developed"),
    ("EEM", "Equities",    "Emerging markets"),
    ("VNQ", "Real assets", "U.S. REITs"),
    ("GLD", "Real assets", "Gold"),
    ("DBC", "Real assets", "Commodities"),
    ("AGG", "Bonds",       "U.S. aggregate"),
    ("TLT", "Bonds",       "Long Treasuries"),
    ("TIP", "Bonds",       "TIPS"),
    ("HYG", "Bonds",       "U.S. high yield"),
    ("BIL", "Cash",        "Cash (T-bills)"),
]
TICKERS = [a[0] for a in ASSETS]

# Discrete correlation bands: (low, high, color, label). Green = diversifying,
# warming through to pink for the assets that move together.
BANDS = [
    (-1.01, 0.0,  "#3F9E73", "< 0"),
    (0.0,   0.3,  "#A4D8BD", "0 – 0.3"),
    (0.3,   0.7,  "#F0CE7A", "0.3 – 0.7"),
    (0.7,   0.9,  "#E9A23B", "0.7 – 0.9"),
    (0.9,   1.01, "#DA5597", "0.9 – 1.0"),
]


def band_index(v):
    for k, (lo, hi, _c, _l) in enumerate(BANDS):
        if lo <= v < hi:
            return k
    return len(BANDS) - 1


def discrete_colorscale():
    """Piecewise-constant colorscale, one flat block per band."""
    n = len(BANDS)
    cs = []
    for i, (_lo, _hi, color, _l) in enumerate(BANDS):
        cs.append([i / n, color])
        cs.append([(i + 1) / n, color])
    return cs


def fetch_returns():
    try:
        import yfinance as yf
        data = yf.download(TICKERS, period="3y", auto_adjust=True, progress=False)["Close"]
        if isinstance(data, pd.Series):
            data = data.to_frame()
        data = data.dropna(how="all")
        returns = data.pct_change().dropna()
        returns = returns.loc[:, returns.count() > 200]
        if returns.shape[1] < len(TICKERS):
            raise ValueError(f"only {returns.shape[1]}/{len(TICKERS)} tickers with data")
        return returns[TICKERS]
    except Exception as e:
        print(f"  yfinance failed ({e}), using synthetic data")
        return None


def make_synthetic():
    """Synthetic returns from a 4-factor model (market, rates, commodity, credit)."""
    rng = np.random.default_rng(42)
    n = 756  # ~3 years of trading days

    mkt    = rng.normal(0, 1, n)
    rate   = rng.normal(0, 1, n)
    comm   = rng.normal(0, 1, n)
    credit = rng.normal(0, 1, n)
    idio   = rng.normal(0, 1, (n, len(TICKERS)))

    #                  mkt   rate  comm  credit   idio
    betas = np.array([
        [ 0.95,  0.00,  0.05,  0.10,  0.30],  # SPY  U.S. large cap
        [ 1.05,  0.00,  0.05,  0.20,  0.40],  # IWM  U.S. small cap
        [ 0.88,  0.00,  0.10,  0.10,  0.40],  # EFA  Intl developed
        [ 0.90,  0.00,  0.20,  0.15,  0.55],  # EEM  Emerging markets
        [ 0.70,  0.25,  0.05,  0.15,  0.55],  # VNQ  U.S. REITs
        [ 0.05,  0.15,  0.55,  0.00,  0.70],  # GLD  Gold
        [ 0.20,  0.00,  0.85,  0.05,  0.55],  # DBC  Commodities
        [-0.05,  0.85,  0.05,  0.20,  0.20],  # AGG  U.S. aggregate
        [-0.10,  1.00,  0.00,  0.00,  0.15],  # TLT  Long Treasuries
        [ 0.00,  0.70,  0.30,  0.10,  0.45],  # TIP  TIPS
        [ 0.45,  0.20,  0.10,  0.70,  0.45],  # HYG  U.S. high yield
        [ 0.00,  0.03,  0.00,  0.00,  0.03],  # BIL  Cash
    ])
    factors = np.column_stack([mkt, rate, comm, credit])
    raw = factors @ betas[:, :4].T + idio * betas[:, 4]
    df = pd.DataFrame(raw * 0.01, columns=TICKERS)
    return df


def build_fig(returns):
    corr = returns.corr().loc[TICKERS, TICKERS]
    classes = [a[1] for a in ASSETS]
    labels  = [f"{i + 1}.  {a[2]}" for i, a in enumerate(ASSETS)]
    n = len(ASSETS)

    raw = corr.values
    # Lower triangle only (including diagonal); upper triangle masked to gaps.
    zb   = np.full((n, n), np.nan)
    txt  = np.full((n, n), "", dtype=object)
    cval = np.full((n, n), np.nan)
    for i in range(n):
        for j in range(n):
            if j <= i:
                v = raw[i, j]
                zb[i, j]   = band_index(v)
                cval[i, j] = v
                txt[i, j]  = f"{v:.2f}".replace("-0.00", "0.00")

    fig = go.Figure(go.Heatmap(
        z=zb,
        x=[classes, labels],
        y=[classes, labels],
        text=txt,
        texttemplate="%{text}",
        textfont=dict(size=11, color=TEXT),
        customdata=cval,
        colorscale=discrete_colorscale(),
        zmin=-0.5, zmax=len(BANDS) - 0.5,
        xgap=2, ygap=2,
        hoverongaps=False,
        hovertemplate="%{customdata:.2f}<extra></extra>",
        colorbar=dict(
            title=dict(text="Correlation", side="top"),
            thickness=16,
            tickmode="array",
            tickvals=list(range(len(BANDS))),
            ticktext=[b[3] for b in BANDS],
            ticks="",
            outlinewidth=0,
            # Tuck the key into the empty upper-right void of the triangle.
            x=0.70, xanchor="left",
            y=0.97, yanchor="top",
            len=0.55,
        ),
    ))

    fig.update_layout(
        xaxis=dict(side="bottom", showgrid=False, tickangle=90,
                   tickfont=dict(size=11), constrain="domain"),
        yaxis=dict(autorange="reversed", showgrid=False,
                   scaleanchor="x", scaleratio=1, constrain="domain"),
        margin=dict(t=20, b=150, l=210, r=40),
    )
    return fig


def generate():
    returns = fetch_returns()
    if returns is None:
        returns = make_synthetic()
        print("  using synthetic correlation data")
    else:
        print(f"  fetched {returns.shape[0]} days × {returns.shape[1]} assets")

    fig = build_fig(returns)
    apply_theme(fig)
    return fig


fig = generate()
fig.show()
Made with Plotly