
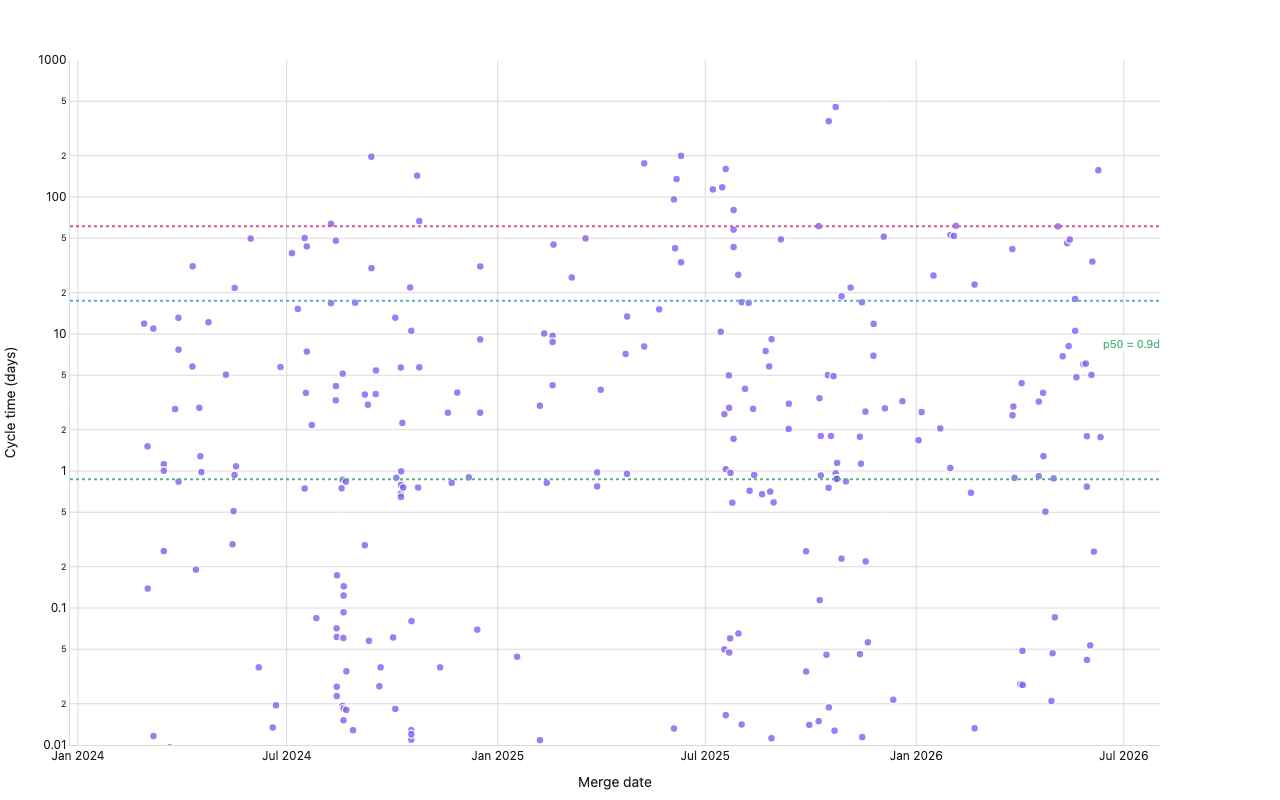
Cycle time scatter
GitHub closed PRs, merge time with percentile lines
Example from the compendium of canonical charts
Python Code
"""Cycle time scatter — GitHub closed PRs, merge time with percentile lines."""
from pathlib import Path

# ── Palette + theme (matching the Plotly Studio gallery these charts ship in) ──
VIOLET, TEAL, GREEN, PINK, ORANGE = "#845EEE", "#52B3D0", "#55B685", "#DA5597", "#E9A23B"
PRIMARY, SECONDARY = VIOLET, TEAL
COLORWAY = [VIOLET, TEAL, GREEN, PINK, ORANGE]
BG, TEXT, GRID, MUTED = "#ffffff", "#1c2024", "#d9d9e0", "#60646c"
FONT = "Inter, -apple-system, BlinkMacSystemFont, sans-serif"
COLORSCALE = [[0, "rgba(132, 94, 238, 0.05)"], [1, "rgba(132, 94, 238, 0.9)"]]


def apply_theme(fig):
    """Light gallery theme: white background, Inter font, soft gridlines."""
    fig.update_layout(
        paper_bgcolor=BG, plot_bgcolor=BG, colorway=COLORWAY,
        font=dict(family=FONT, color=TEXT, size=12),
        legend=dict(font=dict(color=TEXT)),
        hoverlabel=dict(bgcolor="#f0f0f3", font=dict(color=TEXT, family=FONT), bordercolor=GRID),
    )
    fig.update_xaxes(gridcolor=GRID, linecolor=GRID, zerolinecolor=GRID)
    fig.update_yaxes(gridcolor=GRID, linecolor=GRID, zerolinecolor=GRID)


def fetch_csv(url, **kwargs):
    import io
    import pandas as pd
    import requests
    r = requests.get(url, timeout=60)
    r.raise_for_status()
    return pd.read_csv(io.StringIO(r.text), **kwargs)


def fetch_json(url):
    import requests
    r = requests.get(url, timeout=60)
    r.raise_for_status()
    return r.json()

import numpy as np
import pandas as pd
import plotly.graph_objects as go
import requests, warnings, time


REPO = "plotly/plotly.js"
PRS_URL = f"https://api.github.com/repos/{REPO}/pulls"


def fetch_prs():
    warnings.filterwarnings("ignore")
    requests.packages.urllib3.disable_warnings()

    headers = {"Accept": "application/vnd.github+json",
               "X-GitHub-Api-Version": "2022-11-28"}

    prs = []
    page = 1
    while len(prs) < 300:
        r = requests.get(
            PRS_URL,
            params={"state": "closed", "per_page": 100, "page": page},
            headers=headers,
            verify=False,
            timeout=30,
        )
        if r.status_code != 200:
            print(f"  page {page}: status={r.status_code}")
            break

        batch = r.json()
        if not batch:
            break

        # Only include merged PRs (not just closed)
        merged = [p for p in batch if p.get("merged_at")]
        prs.extend(merged)
        print(f"  page {page}: +{len(merged)} merged → {len(prs)} total")
        page += 1
        time.sleep(0.3)

    return prs


def generate():
    print(f"fetching merged PRs for {REPO} …")
    try:
        prs = fetch_prs()
        if not prs:
            raise ValueError("No PRs returned")

        rows = []
        for pr in prs:
            created  = pd.to_datetime(pr["created_at"])
            merged   = pd.to_datetime(pr["merged_at"])
            cycle_h  = (merged - created).total_seconds() / 3600
            rows.append({
                "merged_at": merged,
                "cycle_hours": cycle_h,
                "title": pr["title"][:50],
            })
        df = pd.DataFrame(rows).sort_values("merged_at")
        source = REPO

    except Exception as e:
        print(f"  GitHub PR API failed ({e}); using synthetic cycle time distribution")
        rng = np.random.default_rng(31)
        n = 250
        dates = pd.date_range("2022-01-01", periods=n, freq="1D")
        # Lognormal cycle time: median ~24h, long tail
        cycle_h = rng.lognormal(np.log(24), 1.0, n)
        df = pd.DataFrame({
            "merged_at": dates,
            "cycle_hours": cycle_h,
            "title": [f"PR #{i}" for i in range(n)],
        })
        source = "Synthetic"

    # Drop bad rows; cap outliers at 2 years (730 days)
    df["cycle_hours"] = pd.to_numeric(df["cycle_hours"], errors="coerce")
    df = df.dropna(subset=["cycle_hours"])
    df = df[df["cycle_hours"] > 0]
    df["cycle_days"] = (df["cycle_hours"] / 24).clip(upper=730)

    cycle_days = df["cycle_days"].values
    p50  = float(np.percentile(cycle_days, 50))
    p85  = float(np.percentile(cycle_days, 85))
    p95  = float(np.percentile(cycle_days, 95))

    fig = go.Figure()

    fig.add_trace(go.Scatter(
        x=df["merged_at"],
        y=df["cycle_days"].values,
        mode="markers",
        marker=dict(
            color=VIOLET,
            size=8,
            opacity=0.8,
            line=dict(color="white", width=1.5),
        ),
        text=df["title"],
        hovertemplate="%{x|%Y-%m-%d}<br>%{y:.1f} days<br>%{text}<extra></extra>",
        name="PR",
    ))

    # Percentile lines — use actual day values directly
    for pct, val, color, label in [
        (50,  p50, GREEN,  "p50"),
        (85,  p85, TEAL, "p85"),
        (95,  p95, PINK,   "p95"),
    ]:
        fig.add_hline(
            y=val,
            line=dict(color=color, width=2, dash="dot"),
            annotation_text=f"p{pct} = {val:.1f}d",
            annotation_position="top right",
            annotation_font=dict(size=11, color=color),
            annotation_bgcolor="rgba(255,255,255,0.85)",
        )

    fig.update_layout(
        title=dict(text=f"PR Cycle Time — {source}", x=0.5),
        xaxis=dict(title="Merge date"),
        yaxis=dict(title="Cycle time (days)", type="log", range=[-2, 3]),
        legend=dict(orientation="h", y=1.08),
        margin=dict(t=60, b=50, l=70, r=120),
        height=460,
    )
    apply_theme(fig)
    return fig


fig = generate()
fig.show()
Made with Plotly