
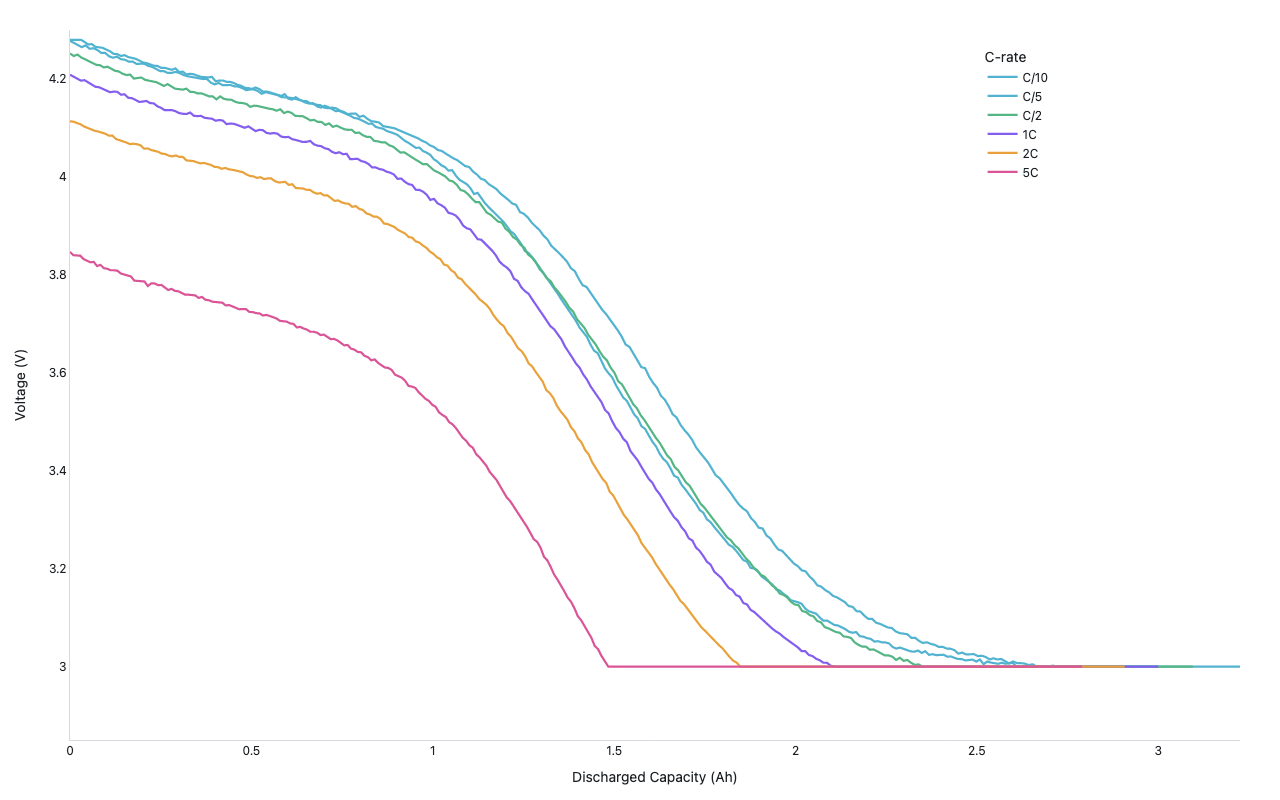
voltage vs capacity discharge curves by C-rate
Battery Engineering
Example from the compendium of canonical charts
Python Code
"""Battery Engineering — voltage vs capacity discharge curves by C-rate."""
from pathlib import Path

# ── Palette + theme (matching the Plotly Studio gallery these charts ship in) ──
VIOLET, TEAL, GREEN, PINK, ORANGE = "#845EEE", "#52B3D0", "#55B685", "#DA5597", "#E9A23B"
PRIMARY, SECONDARY = VIOLET, TEAL
COLORWAY = [VIOLET, TEAL, GREEN, PINK, ORANGE]
BG, TEXT, GRID, MUTED = "#ffffff", "#1c2024", "#d9d9e0", "#60646c"
FONT = "Inter, -apple-system, BlinkMacSystemFont, sans-serif"
COLORSCALE = [[0, "rgba(132, 94, 238, 0.05)"], [1, "rgba(132, 94, 238, 0.9)"]]


def apply_theme(fig):
    """Light gallery theme: white background, Inter font, soft gridlines."""
    fig.update_layout(
        paper_bgcolor=BG, plot_bgcolor=BG, colorway=COLORWAY,
        font=dict(family=FONT, color=TEXT, size=12),
        legend=dict(font=dict(color=TEXT)),
        hoverlabel=dict(bgcolor="#f0f0f3", font=dict(color=TEXT, family=FONT), bordercolor=GRID),
    )
    fig.update_xaxes(gridcolor=GRID, linecolor=GRID, zerolinecolor=GRID)
    fig.update_yaxes(gridcolor=GRID, linecolor=GRID, zerolinecolor=GRID)


def fetch_csv(url, **kwargs):
    import io
    import pandas as pd
    import requests
    r = requests.get(url, timeout=60)
    r.raise_for_status()
    return pd.read_csv(io.StringIO(r.text), **kwargs)


def fetch_json(url):
    import requests
    r = requests.get(url, timeout=60)
    r.raise_for_status()
    return r.json()

import numpy as np
import pandas as pd
import plotly.graph_objects as go


# C-rate comparison colors from slow (cool) to fast (warm)
C_RATES = [
    ("C/10",  0.1,  TEAL),
    ("C/5",   0.2,  "#52B3D0"),
    ("C/2",   0.5,  GREEN),
    ("1C",    1.0,  VIOLET),
    ("2C",    2.0,  ORANGE),
    ("5C",    5.0,  PINK),
]

# NMC cathode parameters
V_OCV   = 4.18   # open-circuit voltage at full charge (V)
V_CUTOFF = 3.00  # discharge cutoff (V)
Q_NOM   = 3.0    # nominal capacity at C/10 (Ah)
R_INT   = 0.030  # internal resistance (Ω) — produces IR drop = I × R


def synthetic_discharge(c_rate, rng):
    """Simulate NMC discharge curve at a given C-rate using a simplified Peukert + IR model."""
    I = c_rate * Q_NOM  # current (A)
    # Peukert: capacity available at c_rate
    k = 1.045
    Q = Q_NOM * (c_rate ** (1 - k)) if c_rate > 0.1 else Q_NOM

    n = 300
    q = np.linspace(0, Q, n)  # discharged capacity (Ah)
    soc = 1 - q / Q           # state of charge 0→1

    # Simplified OCV vs SOC (NMC-like sigmoid + plateau)
    ocv = (V_OCV - 1.18
           + 1.18 / (1 + np.exp(-12 * (soc - 0.5)))
           + 0.12 * np.exp(-8 * (1 - soc)))

    # IR drop + diffusion overpotential
    v = ocv - I * R_INT - 0.02 * c_rate * (1 - soc ** 0.5)
    noise = rng.normal(0, 0.002, n)
    v = np.clip(v + noise, V_CUTOFF, V_OCV + 0.1)

    # Truncate at cutoff
    mask = v >= V_CUTOFF
    return q[mask], v[mask]


def generate():
    print("building battery C-rate discharge curves …")
    rng = np.random.default_rng(48)

    fig = go.Figure()

    for label, c_rate, color in C_RATES:
        q, v = synthetic_discharge(c_rate, rng)
        fig.add_trace(go.Scatter(
            x=q,
            y=v,
            mode="lines",
            name=label,
            line=dict(color=color, width=2.2),
            hovertemplate=f"{label}<br>Q: %{{x:.3f}} Ah<br>V: %{{y:.3f}} V<extra></extra>",
        ))

    fig.update_layout(
        xaxis=dict(title="Discharged Capacity (Ah)", showgrid=False),
        yaxis=dict(title="Voltage (V)", range=[2.85, 4.3], showgrid=False),
        legend=dict(
            title="C-rate",
            orientation="v",
            x=0.78, y=0.98, xanchor="left",
        ),
        margin=dict(t=30, b=60, l=70, r=40),
        height=460,
    )
    apply_theme(fig)
    return fig


fig = generate()
fig.show()
Made with Plotly