
Drag Polar
Aerospace — NACA 0012 airfoil Cl vs. Cd
Example from the compendium of canonical charts
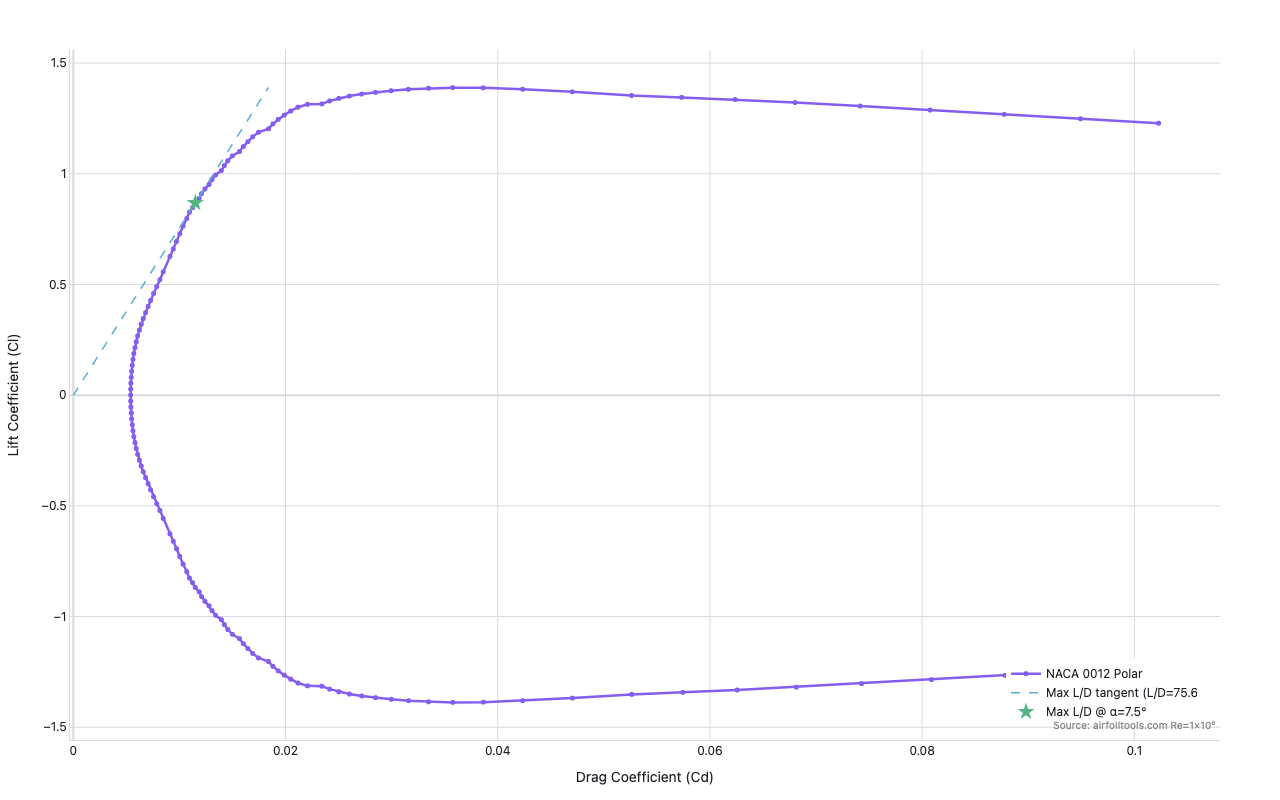
Python Code
"""Aerospace — Drag Polar (NACA 0012 airfoil Cl vs. Cd)."""
from pathlib import Path

# ── Palette + theme (matching the Plotly Studio gallery these charts ship in) ──
VIOLET, TEAL, GREEN, PINK, ORANGE = "#845EEE", "#52B3D0", "#55B685", "#DA5597", "#E9A23B"
PRIMARY, SECONDARY = VIOLET, TEAL
COLORWAY = [VIOLET, TEAL, GREEN, PINK, ORANGE]
BG, TEXT, GRID, MUTED = "#ffffff", "#1c2024", "#d9d9e0", "#60646c"
FONT = "Inter, -apple-system, BlinkMacSystemFont, sans-serif"
COLORSCALE = [[0, "rgba(132, 94, 238, 0.05)"], [1, "rgba(132, 94, 238, 0.9)"]]


def apply_theme(fig):
    """Light gallery theme: white background, Inter font, soft gridlines."""
    fig.update_layout(
        paper_bgcolor=BG, plot_bgcolor=BG, colorway=COLORWAY,
        font=dict(family=FONT, color=TEXT, size=12),
        legend=dict(font=dict(color=TEXT)),
        hoverlabel=dict(bgcolor="#f0f0f3", font=dict(color=TEXT, family=FONT), bordercolor=GRID),
    )
    fig.update_xaxes(gridcolor=GRID, linecolor=GRID, zerolinecolor=GRID)
    fig.update_yaxes(gridcolor=GRID, linecolor=GRID, zerolinecolor=GRID)


def fetch_csv(url, **kwargs):
    import io
    import pandas as pd
    import requests
    r = requests.get(url, timeout=60)
    r.raise_for_status()
    return pd.read_csv(io.StringIO(r.text), **kwargs)


def fetch_json(url):
    import requests
    r = requests.get(url, timeout=60)
    r.raise_for_status()
    return r.json()

import numpy as np
import requests
import plotly.graph_objects as go


def _fetch_xfoil_polar():
    """Fetch NACA 0012 polar from airfoiltools.com (plain HTTP)."""
    url = "http://airfoiltools.com/polar/csv?polar=xf-n0012-il-1000000"
    r = requests.get(url, timeout=30, verify=False)
    r.raise_for_status()
    lines = r.text.splitlines()
    # Find the header row
    header_idx = None
    for i, line in enumerate(lines):
        stripped = line.strip()
        if stripped.startswith("Alpha") or (stripped and stripped.split(",")[0].strip() == "Alpha"):
            header_idx = i
            break
    if header_idx is None:
        raise ValueError("header row not found")
    csv_text = "\n".join(lines[header_idx:])
    import io, pandas as pd
    df = pd.read_csv(io.StringIO(csv_text))
    df.columns = [c.strip() for c in df.columns]
    return df


def _synthetic_polar():
    """Thin-airfoil + parasite drag approximation for NACA 0012."""
    import pandas as pd
    alpha_deg = np.linspace(-12, 15, 80)
    alpha_rad = np.radians(alpha_deg)
    # Lift: 2π slope, stall modeled with tanh
    Cl_ideal = 2 * np.pi * np.sin(alpha_rad)
    # Soft stall above ~10°
    stall_factor = 1 - 0.5 * np.clip((np.abs(alpha_deg) - 10) / 5, 0, 1)
    Cl = Cl_ideal * stall_factor
    # Drag: parabolic polar Cd = Cd0 + Cl^2/(pi*e*AR), AR→∞ so use finite span
    Cd0 = 0.006
    e = 0.9
    AR = 10
    Cd = Cd0 + Cl ** 2 / (np.pi * e * AR)
    # Add separation drag at high alpha
    sep = np.clip((np.abs(alpha_deg) - 10) / 5, 0, 1)
    Cd += 0.05 * sep
    return pd.DataFrame({"Alpha": alpha_deg, "Cl": Cl, "Cd": Cd})


def generate():
    try:
        df = _fetch_xfoil_polar()
        print(f"  fetched airfoiltools polar: {len(df)} rows, cols={list(df.columns)}")
        used_synthetic = False
    except Exception as e:
        print(f"  airfoiltools fetch failed ({e}), using synthetic data")
        df = _synthetic_polar()
        used_synthetic = True

    Cd = df["Cd"].values
    Cl = df["Cl"].values
    Alpha = df["Alpha"].values

    # Max L/D point
    with np.errstate(divide="ignore", invalid="ignore"):
        ld = np.where(Cd > 0, Cl / Cd, 0)
    best_idx = np.argmax(ld)
    best_Cd = Cd[best_idx]
    best_Cl = Cl[best_idx]
    best_alpha = Alpha[best_idx]
    best_ld = ld[best_idx]

    fig = go.Figure()

    # Main polar curve
    fig.add_trace(go.Scatter(
        x=Cd,
        y=Cl,
        mode="lines+markers",
        line=dict(color=VIOLET, width=2.5),
        marker=dict(size=5),
        name="NACA 0012 Polar",
        hovertemplate="α=%{customdata:.1f}°<br>Cd=%{x:.5f}<br>Cl=%{y:.4f}<extra></extra>",
        customdata=Alpha,
    ))

    # Max L/D tangent line from origin
    t = np.array([0, best_Cd * 1.6])
    fig.add_trace(go.Scatter(
        x=t,
        y=t * best_ld,
        mode="lines",
        line=dict(color=TEAL, width=1.5, dash="dash"),
        name=f"Max L/D tangent (L/D={best_ld:.1f})",
        hoverinfo="skip",
    ))

    # Max L/D marker
    fig.add_trace(go.Scatter(
        x=[best_Cd],
        y=[best_Cl],
        mode="markers",
        marker=dict(size=13, color=GREEN, symbol="star"),
        name=f"Max L/D @ α={best_alpha:.1f}°",
        hovertemplate=f"Max L/D = {best_ld:.1f}<br>α={best_alpha:.1f}°<br>Cd={best_Cd:.5f}<br>Cl={best_Cl:.4f}<extra></extra>",
    ))

    fig.add_annotation(
        x=best_Cd,
        y=best_Cl + 0.06,
        text=f"Max L/D = {best_ld:.1f}<br>α = {best_alpha:.1f}°",
        showarrow=True,
        arrowhead=2,
        arrowcolor=GREEN,
        font=dict(size=12, color=TEXT),
        ax=40,
        ay=-30,
    )

    source_note = "Synthetic (thin airfoil + parabolic drag)" if used_synthetic else "Source: airfoiltools.com Re=1×10⁶"
    fig.update_layout(
        xaxis=dict(title="Drag Coefficient (Cd)"),
        yaxis=dict(title="Lift Coefficient (Cl)"),
        legend=dict(x=0.98, y=0.02, xanchor="right", yanchor="bottom"),
        margin=dict(t=50, b=60, l=70, r=60),
        annotations=[
            dict(
                x=0.99, y=0.01,
                xref="paper", yref="paper",
                text=source_note,
                showarrow=False,
                font=dict(size=10, color="#888"),
                xanchor="right",
            ),
        ] + [ann for ann in [] if False],  # placeholder; real annotation added above
    )

    # Re-add the annotation properly (update_layout annotations replaces, use add_annotation)
    apply_theme(fig)
    return fig


fig = generate()
fig.show()
Made with Plotly