
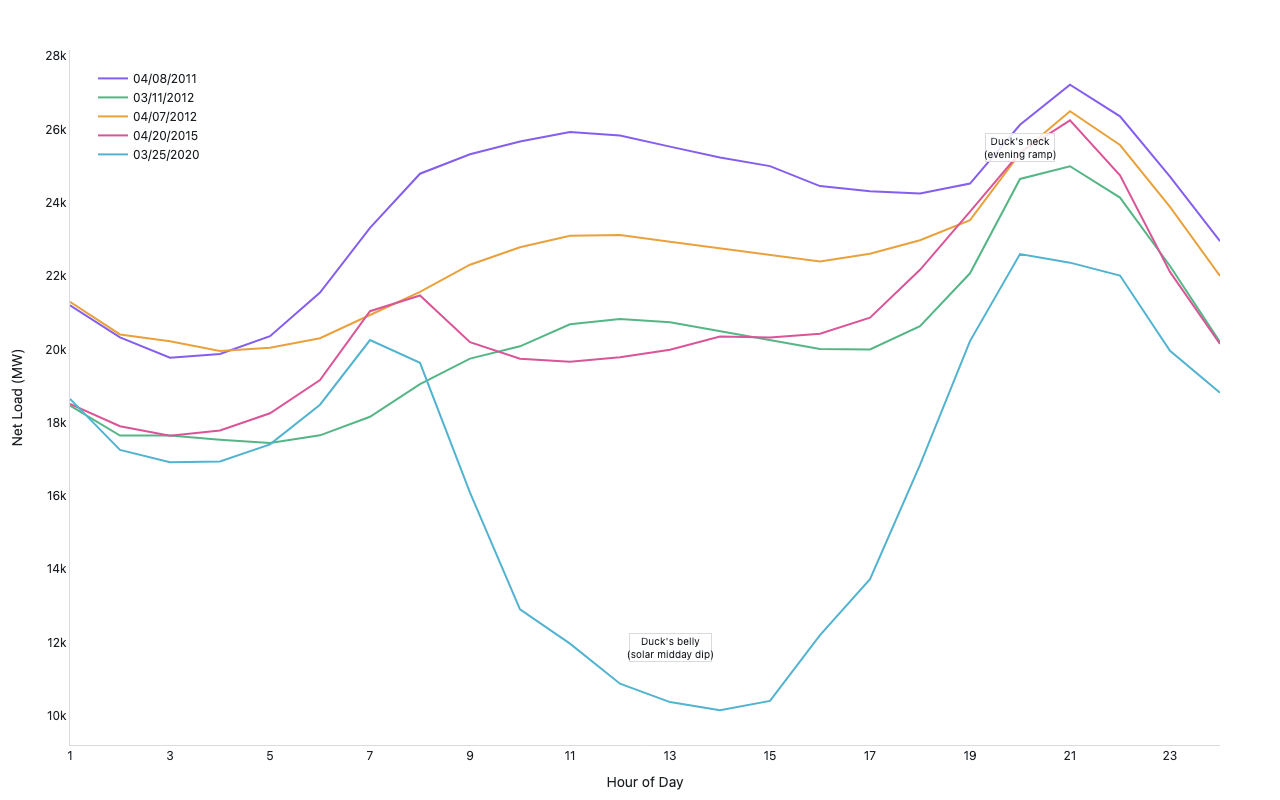
California duck curve
Grid Operations — net load by hour, spring days
Example from the compendium of canonical charts
Python Code
"""Grid Operations — California duck curve (net load by hour, spring days)."""
from pathlib import Path

# ── Palette + theme (matching the Plotly Studio gallery these charts ship in) ──
VIOLET, TEAL, GREEN, PINK, ORANGE = "#845EEE", "#52B3D0", "#55B685", "#DA5597", "#E9A23B"
PRIMARY, SECONDARY = VIOLET, TEAL
COLORWAY = [VIOLET, TEAL, GREEN, PINK, ORANGE]
BG, TEXT, GRID, MUTED = "#ffffff", "#1c2024", "#d9d9e0", "#60646c"
FONT = "Inter, -apple-system, BlinkMacSystemFont, sans-serif"
COLORSCALE = [[0, "rgba(132, 94, 238, 0.05)"], [1, "rgba(132, 94, 238, 0.9)"]]


def apply_theme(fig):
    """Light gallery theme: white background, Inter font, soft gridlines."""
    fig.update_layout(
        paper_bgcolor=BG, plot_bgcolor=BG, colorway=COLORWAY,
        font=dict(family=FONT, color=TEXT, size=12),
        legend=dict(font=dict(color=TEXT)),
        hoverlabel=dict(bgcolor="#f0f0f3", font=dict(color=TEXT, family=FONT), bordercolor=GRID),
    )
    fig.update_xaxes(gridcolor=GRID, linecolor=GRID, zerolinecolor=GRID)
    fig.update_yaxes(gridcolor=GRID, linecolor=GRID, zerolinecolor=GRID)


def fetch_csv(url, **kwargs):
    import io
    import pandas as pd
    import requests
    r = requests.get(url, timeout=60)
    r.raise_for_status()
    return pd.read_csv(io.StringIO(r.text), **kwargs)


def fetch_json(url):
    import requests
    r = requests.get(url, timeout=60)
    r.raise_for_status()
    return r.json()

import numpy as np
import pandas as pd
import plotly.graph_objects as go

URL = "https://raw.githubusercontent.com/dlevonian/california_renewables/master/caiso_final.csv"


def synthetic_duck(year=2019):
    """Synthetic spring duck-curve days."""
    hours = np.arange(1, 25)
    # Approximate CAISO net load profile for spring days
    profiles = {
        "Mar 21": [23000, 22000, 21500, 21000, 21200, 22500,
                   23000, 22000, 19000, 15000, 12000, 11000,
                   10500, 10800, 11500, 13000, 16000, 20000,
                   24000, 26000, 26500, 26000, 25000, 24000],
        "Mar 28": [22500, 21500, 21000, 20500, 20800, 22000,
                   22500, 21000, 18000, 14000, 11500, 10500,
                   10000, 10300, 11000, 12500, 15500, 19500,
                   23500, 25500, 26000, 25500, 24500, 23500],
        "Apr 4":  [22000, 21000, 20500, 20000, 20300, 21500,
                   22000, 20500, 17000, 13000, 10500, 9500,
                   9000,  9300,  10000, 11500, 15000, 19000,
                   23000, 25000, 25500, 25000, 24000, 23000],
        "Apr 11": [21500, 20500, 20000, 19500, 19800, 21000,
                   21500, 20000, 16500, 12500, 10000, 9000,
                   8500,  8800,  9500,  11000, 14500, 18500,
                   22500, 24500, 25000, 24500, 23500, 22500],
        "Apr 18": [21000, 20000, 19500, 19000, 19300, 20500,
                   21000, 19500, 16000, 12000, 9500,  8500,
                   8000,  8300,  9000,  10500, 14000, 18000,
                   22000, 24000, 24500, 24000, 23000, 22000],
    }
    return hours, profiles


def generate():
    try:
        print("fetching CAISO renewables CSV …")
        df = fetch_csv(URL)
        df.columns = [c.strip() for c in df.columns]
        print(f"  loaded {len(df)} rows; columns: {list(df.columns)}")

        # Find required columns
        def find_col(candidates):
            for c in candidates:
                for col in df.columns:
                    if c.lower() == col.lower():
                        return col
            return None

        date_col   = find_col(["DATE", "date"])
        hour_col   = find_col(["HOUR", "hour", "HR"])
        total_col  = find_col(["TOTAL", "total", "DEMAND"])
        solar_pv   = find_col(["SOLAR_PV", "solar_pv"])
        solar_th   = find_col(["SOLAR_THERMAL", "solar_thermal"])
        wind_col   = find_col(["WIND", "wind"])

        missing = [n for n, c in [("DATE", date_col), ("HOUR", hour_col),
                                   ("TOTAL", total_col), ("SOLAR_PV", solar_pv),
                                   ("WIND", wind_col)] if c is None]
        if missing:
            raise ValueError(f"Missing columns: {missing}")

        # Parse date
        df[date_col] = pd.to_numeric(df[date_col], errors="coerce")
        df[hour_col] = pd.to_numeric(df[hour_col], errors="coerce")
        for col in [total_col, solar_pv, solar_th, wind_col]:
            if col:
                df[col] = pd.to_numeric(df[col], errors="coerce")

        # Net load
        renew = df[solar_pv].fillna(0)
        if solar_th:
            renew += df[solar_th].fillna(0)
        renew += df[wind_col].fillna(0)
        df["net_load"] = df[total_col] - renew

        # Filter spring (March-April)
        df["month"] = (df[date_col] // 100) % 100  # YYYYMMDD → MM
        spring = df[df["month"].isin([3, 4])].dropna(subset=[hour_col, "net_load"])

        # Pick 5 representative days (sample by unique dates)
        unique_dates = spring[date_col].dropna().unique()
        if len(unique_dates) < 5:
            raise ValueError(f"Too few spring dates: {len(unique_dates)}")
        np.random.seed(42)
        chosen = np.sort(np.random.choice(unique_dates, 5, replace=False))

        days_data = {}
        for d in chosen:
            ddf = spring[spring[date_col] == d].sort_values(hour_col)
            if len(ddf) >= 20:
                s = str(int(d))
                label = f"{s[4:6]}/{s[6:8]}/{s[:4]}"
                days_data[label] = (ddf[hour_col].values, ddf["net_load"].values)

        if len(days_data) < 3:
            raise ValueError("Not enough days with full data")

        use_synthetic = False

    except Exception as e:
        print(f"  fetch failed ({e}); using synthetic duck curve")
        use_synthetic = True

    colors = [VIOLET, GREEN, ORANGE, PINK, TEAL]

    fig = go.Figure()

    if use_synthetic:
        hours, profiles = synthetic_duck()
        for i, (label, vals) in enumerate(profiles.items()):
            fig.add_trace(go.Scatter(
                x=hours, y=vals,
                mode="lines",
                name=label,
                line=dict(color=colors[i % len(colors)], width=2),
                hovertemplate=f"{label}<br>Hour %{{x}}: %{{y:,.0f}} MW<extra></extra>",
            ))
    else:
        for i, (label, (hrs, nl)) in enumerate(days_data.items()):
            fig.add_trace(go.Scatter(
                x=hrs, y=nl,
                mode="lines",
                name=label,
                line=dict(color=colors[i % len(colors)], width=2),
                hovertemplate=f"{label}<br>Hour %{{x}}: %{{y:,.0f}} MW<extra></extra>",
            ))

    # Annotate duck anatomy
    fig.add_annotation(
        x=13,
        text="Duck's belly<br>(solar midday dip)",
        showarrow=False,
        font=dict(size=10),
        bgcolor="rgba(255,255,255,0.85)",
        bordercolor="#d9d9e0",
        yref="paper", y=0.12,
        xanchor="center",
    )
    fig.add_annotation(
        x=20,
        text="Duck's neck<br>(evening ramp)",
        showarrow=False,
        font=dict(size=10),
        bgcolor="rgba(255,255,255,0.85)",
        bordercolor="#d9d9e0",
        yref="paper", y=0.88,
        xanchor="center",
    )

    fig.update_layout(
        xaxis=dict(title="Hour of Day", tickvals=list(range(1, 25, 2)), range=[1, 24], showgrid=False),
        yaxis=dict(title="Net Load (MW)", showgrid=False),
        legend=dict(x=0.02, y=0.98, xanchor="left", yanchor="top"),
        margin=dict(t=50, b=50, l=70, r=60),
    )
    apply_theme(fig)
    return fig


fig = generate()
fig.show()
Made with Plotly