
Efficient frontier via random portfolio simulation
Portfolio Management
Example from the compendium of canonical charts
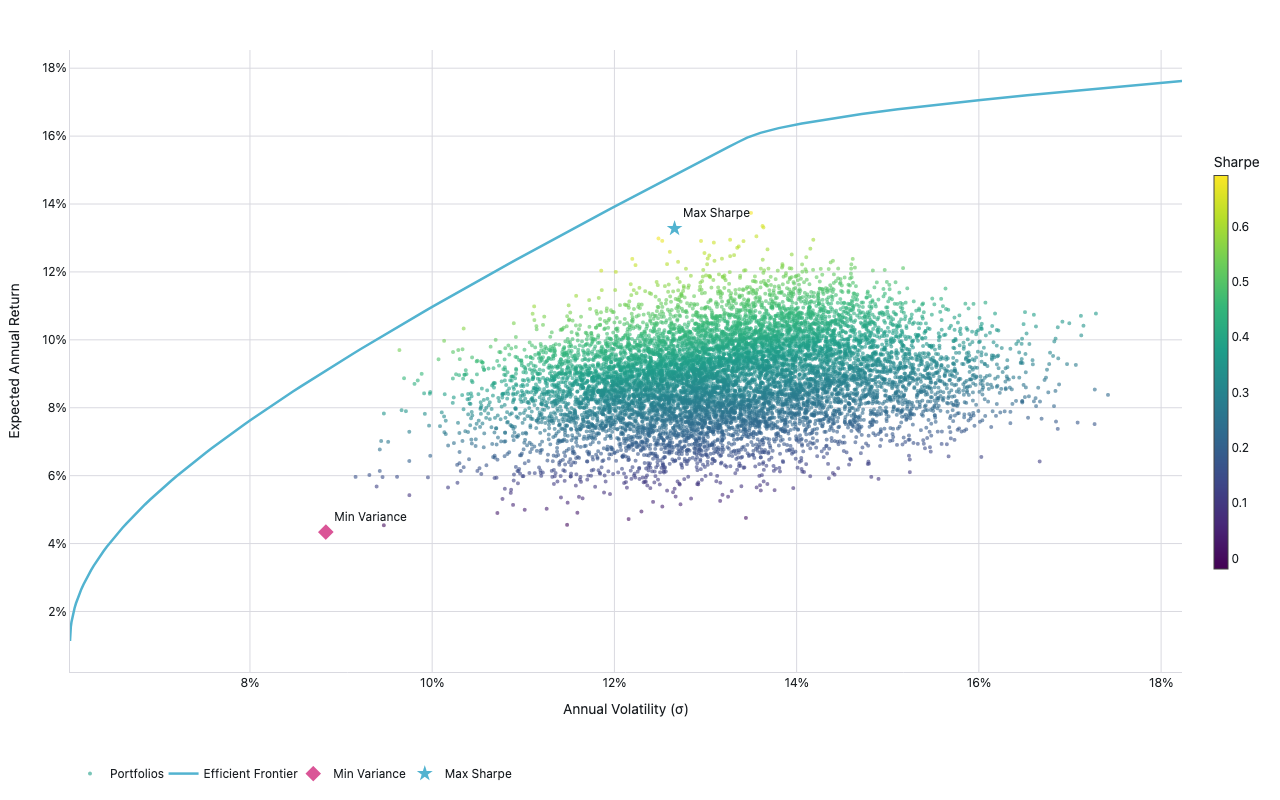
Python Code
"""Portfolio Management — Efficient frontier via random portfolio simulation."""
from pathlib import Path

# ── Palette + theme (matching the Plotly Studio gallery these charts ship in) ──
VIOLET, TEAL, GREEN, PINK, ORANGE = "#845EEE", "#52B3D0", "#55B685", "#DA5597", "#E9A23B"
PRIMARY, SECONDARY = VIOLET, TEAL
COLORWAY = [VIOLET, TEAL, GREEN, PINK, ORANGE]
BG, TEXT, GRID, MUTED = "#ffffff", "#1c2024", "#d9d9e0", "#60646c"
FONT = "Inter, -apple-system, BlinkMacSystemFont, sans-serif"
COLORSCALE = [[0, "rgba(132, 94, 238, 0.05)"], [1, "rgba(132, 94, 238, 0.9)"]]


def apply_theme(fig):
    """Light gallery theme: white background, Inter font, soft gridlines."""
    fig.update_layout(
        paper_bgcolor=BG, plot_bgcolor=BG, colorway=COLORWAY,
        font=dict(family=FONT, color=TEXT, size=12),
        legend=dict(font=dict(color=TEXT)),
        hoverlabel=dict(bgcolor="#f0f0f3", font=dict(color=TEXT, family=FONT), bordercolor=GRID),
    )
    fig.update_xaxes(gridcolor=GRID, linecolor=GRID, zerolinecolor=GRID)
    fig.update_yaxes(gridcolor=GRID, linecolor=GRID, zerolinecolor=GRID)


def fetch_csv(url, **kwargs):
    import io
    import pandas as pd
    import requests
    r = requests.get(url, timeout=60)
    r.raise_for_status()
    return pd.read_csv(io.StringIO(r.text), **kwargs)


def fetch_json(url):
    import requests
    r = requests.get(url, timeout=60)
    r.raise_for_status()
    return r.json()

import numpy as np
import pandas as pd
import plotly.graph_objects as go
import yfinance as yf
import warnings

warnings.filterwarnings("ignore")

TICKERS = ["SPY", "AGG", "GLD", "VNQ", "EFA", "EEM", "IWM"]
N_PORTFOLIOS = 10000
RF = 0.045  # risk-free rate (approx)


def generate():
    print("downloading 5-year daily closes from yfinance …")
    raw = yf.download(TICKERS, period="5y", auto_adjust=True, progress=False)["Close"]
    raw = raw.dropna()

    returns = raw.pct_change().dropna()
    ann_mean = returns.mean() * 252
    ann_cov = returns.cov() * 252
    n = len(TICKERS)

    rng = np.random.default_rng(42)
    weights_all = rng.random((N_PORTFOLIOS, n))
    weights_all = weights_all / weights_all.sum(axis=1, keepdims=True)

    port_returns = weights_all @ ann_mean.values
    port_vars = np.einsum("ij,jk,ik->i", weights_all, ann_cov.values, weights_all)
    port_sigmas = np.sqrt(port_vars)
    port_sharpe = (port_returns - RF) / port_sigmas

    # Efficient frontier via quadratic programming (minimize variance for each target return)
    from scipy.optimize import minimize

    mu = ann_mean.values
    cov = ann_cov.values

    def portfolio_variance(w, cov):
        return float(w @ cov @ w)

    def min_var_for_target(target_ret):
        cons = [
            {"type": "eq", "fun": lambda w: w.sum() - 1},
            {"type": "eq", "fun": lambda w: w @ mu - target_ret},
        ]
        bounds = [(0, 1)] * n
        w0 = np.ones(n) / n
        res = minimize(portfolio_variance, w0, args=(cov,), method="SLSQP",
                       bounds=bounds, constraints=cons,
                       options={"ftol": 1e-10, "maxiter": 500})
        if res.success:
            sig = float(np.sqrt(res.fun))
            return sig, target_ret
        return None

    # Trace frontier from min-variance return to max-return asset
    mv_res = minimize(portfolio_variance, np.ones(n) / n, args=(cov,),
                      method="SLSQP", bounds=[(0, 1)] * n,
                      constraints=[{"type": "eq", "fun": lambda w: w.sum() - 1}],
                      options={"ftol": 1e-12, "maxiter": 500})
    ret_min = float(mv_res.x @ mu) if mv_res.success else mu.min()
    ret_max = float(mu.max())
    target_rets = np.linspace(ret_min, ret_max, 120)

    frontier_x, frontier_y = [], []
    for r in target_rets:
        result = min_var_for_target(r)
        if result:
            frontier_x.append(result[0])
            frontier_y.append(result[1])

    # Min-variance and max-Sharpe portfolios
    mv_idx = np.argmin(port_sigmas)
    ms_idx = np.argmax(port_sharpe)

    fig = go.Figure()

    # Cloud
    fig.add_trace(go.Scatter(
        x=port_sigmas,
        y=port_returns,
        mode="markers",
        marker=dict(
            size=4,
            color=port_sharpe,
            colorscale="Viridis",
            opacity=0.6,
            colorbar=dict(title="Sharpe", thickness=14, len=0.7),
            showscale=True,
        ),
        text=[f"Sharpe: {s:.2f}<br>σ: {x:.1%}<br>r: {y:.1%}"
              for s, x, y in zip(port_sharpe, port_sigmas, port_returns)],
        hoverinfo="text",
        name="Portfolios",
    ))

    # Frontier line
    fig.add_trace(go.Scatter(
        x=frontier_x,
        y=frontier_y,
        mode="lines",
        line=dict(color=TEAL, width=2.5, dash="solid"),
        name="Efficient Frontier",
    ))

    # Min-variance point
    fig.add_trace(go.Scatter(
        x=[port_sigmas[mv_idx]],
        y=[port_returns[mv_idx]],
        mode="markers+text",
        marker=dict(size=12, color=PINK, symbol="diamond"),
        text=["Min Variance"],
        textposition="top right",
        name="Min Variance",
    ))

    # Max-Sharpe point
    fig.add_trace(go.Scatter(
        x=[port_sigmas[ms_idx]],
        y=[port_returns[ms_idx]],
        mode="markers+text",
        marker=dict(size=12, color=TEAL, symbol="star"),
        text=["Max Sharpe"],
        textposition="top right",
        name="Max Sharpe",
    ))

    fig.update_layout(
        xaxis=dict(title="Annual Volatility (σ)", tickformat=".0%"),
        yaxis=dict(title="Expected Annual Return", tickformat=".0%"),
        legend=dict(orientation="h", y=-0.14, x=0),
        margin=dict(t=50, b=80, l=70, r=70),
    )
    apply_theme(fig)
    return fig


fig = generate()
fig.show()
Made with Plotly