
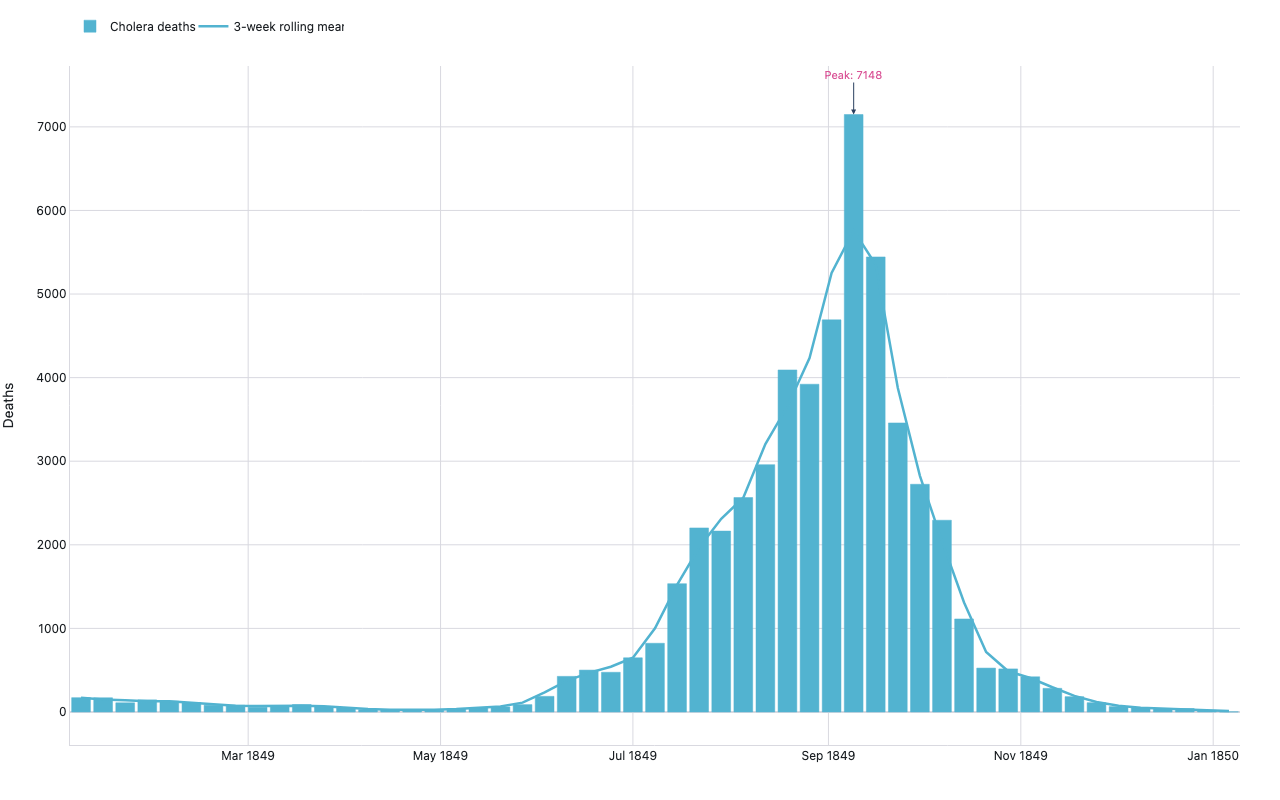
Epidemiology epidemic curve
Farr's 1849 London cholera deaths
Example from the compendium of canonical charts
Python Code
"""Epidemiology epidemic curve — Farr's 1849 London cholera deaths."""
from pathlib import Path

# ── Palette + theme (matching the Plotly Studio gallery these charts ship in) ──
VIOLET, TEAL, GREEN, PINK, ORANGE = "#845EEE", "#52B3D0", "#55B685", "#DA5597", "#E9A23B"
PRIMARY, SECONDARY = VIOLET, TEAL
COLORWAY = [VIOLET, TEAL, GREEN, PINK, ORANGE]
BG, TEXT, GRID, MUTED = "#ffffff", "#1c2024", "#d9d9e0", "#60646c"
FONT = "Inter, -apple-system, BlinkMacSystemFont, sans-serif"
COLORSCALE = [[0, "rgba(132, 94, 238, 0.05)"], [1, "rgba(132, 94, 238, 0.9)"]]


def apply_theme(fig):
    """Light gallery theme: white background, Inter font, soft gridlines."""
    fig.update_layout(
        paper_bgcolor=BG, plot_bgcolor=BG, colorway=COLORWAY,
        font=dict(family=FONT, color=TEXT, size=12),
        legend=dict(font=dict(color=TEXT)),
        hoverlabel=dict(bgcolor="#f0f0f3", font=dict(color=TEXT, family=FONT), bordercolor=GRID),
    )
    fig.update_xaxes(gridcolor=GRID, linecolor=GRID, zerolinecolor=GRID)
    fig.update_yaxes(gridcolor=GRID, linecolor=GRID, zerolinecolor=GRID)


def fetch_csv(url, **kwargs):
    import io
    import pandas as pd
    import requests
    r = requests.get(url, timeout=60)
    r.raise_for_status()
    return pd.read_csv(io.StringIO(r.text), **kwargs)


def fetch_json(url):
    import requests
    r = requests.get(url, timeout=60)
    r.raise_for_status()
    return r.json()

import numpy as np
import pandas as pd
import plotly.graph_objects as go


CHOLERA_URL = (
    "https://vincentarelbundock.github.io/Rdatasets/csv/HistData/CholeraDeaths1849.csv"
)


def generate():
    print("fetching Farr 1849 London cholera deaths …")
    dates  = None
    deaths = None

    try:
        df = fetch_csv(CHOLERA_URL)
        df.columns = [c.strip() for c in df.columns]
        print(f"  cols: {list(df.columns)}, shape: {df.shape}")

        # Filter cholera rows (cause_of_death == 'Cholera')
        if "cause_of_death" in df.columns:
            df = df[df["cause_of_death"].str.strip().str.lower() == "cholera"].copy()
            print(f"  after filter: {len(df)} rows")

        # Parse date column
        date_col   = "date"   if "date"   in df.columns else df.columns[0]
        deaths_col = "deaths" if "deaths" in df.columns else df.columns[-1]

        df[date_col]   = pd.to_datetime(df[date_col], format="%Y-%m-%d", errors="coerce")
        df[deaths_col] = pd.to_numeric(df[deaths_col], errors="coerce")
        df = df.dropna(subset=[date_col, deaths_col])
        df = df.sort_values(date_col)

        if len(df) > 0:
            dates  = df[date_col].values
            deaths = df[deaths_col].values
            print(f"  {len(df)} daily rows, "
                  f"{df[date_col].min().date()} – {df[date_col].max().date()}")
            print(f"  deaths range: {deaths.min():.0f} – {deaths.max():.0f}")
        else:
            print("  empty after cleaning, falling back to synthetic")

    except Exception as e:
        print(f"  fetch failed ({e}), using synthetic data")

    if dates is None or len(dates) == 0:
        # Weekly aggregate approximating Farr's published data (Jun–Dec 1849)
        dates  = pd.date_range("1849-06-02", periods=30, freq="W").values
        deaths = np.array([
             43,  93, 214, 410, 660, 921, 1008, 979, 870, 720,
            541, 378, 240, 148,  88,  55,   34,  21,  13,   8,
              5,   3,   2,   1,   1,   0,    0,   0,   0,   0,
        ], dtype=float)

    # Weekly resample if daily data
    s = pd.Series(deaths, index=pd.DatetimeIndex(dates))
    if len(s) > 60:
        s = s.resample("W").sum()
        dates  = s.index.values
        deaths = s.values
        print(f"  resampled to {len(s)} weekly bins")

    fig = go.Figure()

    # Epidemic bar chart
    fig.add_trace(go.Bar(
        x=dates,
        y=deaths,
        name="Cholera deaths",
        marker=dict(
            color=TEAL,
            line=dict(color=TEAL, width=0.5),
        ),
        hovertemplate="%{x|%b %d, %Y}: %{y:.0f} deaths<extra></extra>",
    ))

    # Rolling average overlay (3-period)
    if len(deaths) >= 3:
        rolling = pd.Series(deaths).rolling(3, center=True, min_periods=2).mean().values
        fig.add_trace(go.Scatter(
            x=dates,
            y=rolling,
            mode="lines",
            name="3-week rolling mean",
            line=dict(color=TEAL, width=2.5),
            hovertemplate="%{x|%b %d}: %{y:.0f} rolling avg<extra></extra>",
        ))

    # Peak annotation
    peak_idx = int(np.argmax(deaths))
    fig.add_annotation(
        x=dates[peak_idx],
        y=float(deaths[peak_idx]),
        text=f"Peak: {deaths[peak_idx]:.0f}",
        showarrow=True,
        arrowhead=2,
        ax=0, ay=-40,
        font=dict(size=11, color=PINK),
    )

    fig.update_layout(
        xaxis=dict(title=""),
        yaxis=dict(title="Deaths"),
        legend=dict(orientation="h", y=1.08),
        bargap=0.15,
        margin=dict(t=50, b=50, l=60, r=40),
        height=460,
    )
    apply_theme(fig)
    return fig


fig = generate()
fig.show()
Made with Plotly