
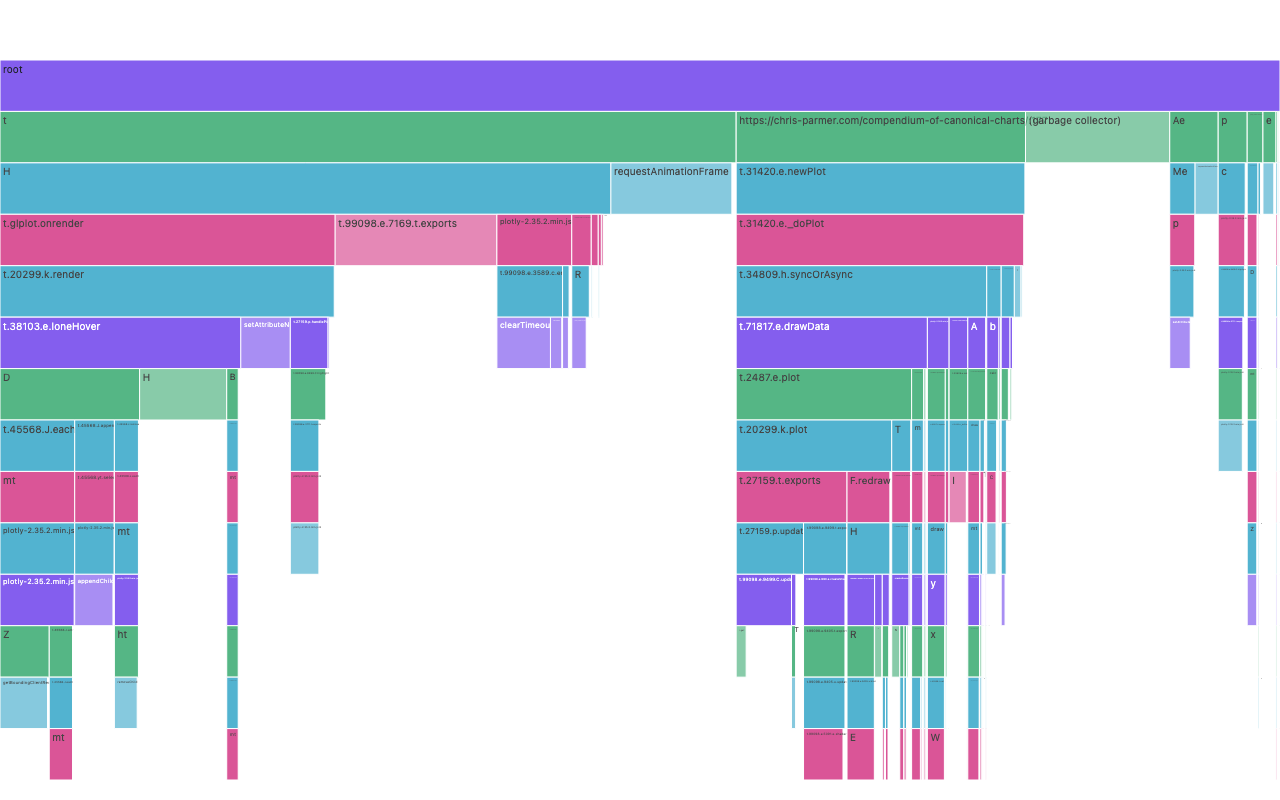
Flame graph
Chrome DevTools CPU profile rendered as go.Icicle
Example from the compendium of canonical charts
Python Code
"""Flame graph — Chrome DevTools CPU profile rendered as go.Icicle.

Capture a profile in your browser and drop it into this folder; it gets picked
up automatically (newest wins). Two formats are supported:

    Performance panel → record → stop → ⤓ "Save profile"   → Trace-*.json(.gz)
    ⋮ → More tools → JavaScript Profiler → record → Save   → *.cpuprofile

The Performance trace embeds its CPU samples across many "ProfileChunk" events;
the .cpuprofile is the same sample/node data in one object. Both reduce to the
same thing: a node tree + a stream of (sample, timeDelta) pairs that we fold
into stacks weighted by sampled CPU time. With no profile present the chart
falls back to a synthetic web server profile so it always renders.
"""
import json
import gzip
from pathlib import Path

# ── Palette + theme (matching the Plotly Studio gallery these charts ship in) ──
VIOLET, TEAL, GREEN, PINK, ORANGE = "#845EEE", "#52B3D0", "#55B685", "#DA5597", "#E9A23B"
PRIMARY, SECONDARY = VIOLET, TEAL
COLORWAY = [VIOLET, TEAL, GREEN, PINK, ORANGE]
BG, TEXT, GRID, MUTED = "#ffffff", "#1c2024", "#d9d9e0", "#60646c"
FONT = "Inter, -apple-system, BlinkMacSystemFont, sans-serif"
COLORSCALE = [[0, "rgba(132, 94, 238, 0.05)"], [1, "rgba(132, 94, 238, 0.9)"]]


def apply_theme(fig):
    """Light gallery theme: white background, Inter font, soft gridlines."""
    fig.update_layout(
        paper_bgcolor=BG, plot_bgcolor=BG, colorway=COLORWAY,
        font=dict(family=FONT, color=TEXT, size=12),
        legend=dict(font=dict(color=TEXT)),
        hoverlabel=dict(bgcolor="#f0f0f3", font=dict(color=TEXT, family=FONT), bordercolor=GRID),
    )
    fig.update_xaxes(gridcolor=GRID, linecolor=GRID, zerolinecolor=GRID)
    fig.update_yaxes(gridcolor=GRID, linecolor=GRID, zerolinecolor=GRID)


def fetch_csv(url, **kwargs):
    import io
    import pandas as pd
    import requests
    r = requests.get(url, timeout=60)
    r.raise_for_status()
    return pd.read_csv(io.StringIO(r.text), **kwargs)


def fetch_json(url):
    import requests
    r = requests.get(url, timeout=60)
    r.raise_for_status()
    return r.json()

import plotly.graph_objects as go
import warnings

HERE = Path(__file__).parent

# Meta frames the V8 profiler injects but which only add noise to the flames —
# "(idle)" in particular dominates an interactive recording. "_readCallback" is
# the flat page-load network-read leaf: lots of self-time, no call tree beneath
# it, so it just crowds out the actual JS flames. Drop them all.
SKIP_FRAMES = {"(idle)", "(root)", "(program)", "_readCallback"}


def find_profile():
    """Find a profile capture next to this script (newest wins)."""
    candidates = sorted(
        [
            *HERE.glob("*.cpuprofile"),
            *HERE.glob("*[Tt]race*.json"),
            *HERE.glob("*[Tt]race*.json.gz"),
            *HERE.glob("*profile*.json"),
        ],
        key=lambda p: p.stat().st_mtime,
        reverse=True,
    )
    return candidates[0] if candidates else None


def read_json(path):
    """Load JSON from a plain or gzipped file."""
    opener = gzip.open if path.suffix == ".gz" else open
    with opener(path, "rt", encoding="utf-8") as f:
        return json.load(f)


def frame_name(call_frame):
    """Human label for a V8 callFrame: function name, or url:line for anon."""
    name = (call_frame.get("functionName") or "").strip()
    if name:
        return name
    url = call_frame.get("url") or ""
    if url:
        tail = url.rsplit("/", 1)[-1] or url
        line = call_frame.get("lineNumber", -1)
        return f"{tail}:{line + 1}" if line >= 0 else tail
    return "(anonymous)"


def extract_samples(data):
    """Normalize either profile format to (nodes, samples, timeDeltas).

    A .cpuprofile carries nodes/samples/timeDeltas at the top level. A
    Performance trace spreads them across "ProfileChunk" trace events, one per
    chunk — so merge every chunk belonging to the busiest sampled thread.
    """
    if "traceEvents" in data:
        chunks = [e for e in data["traceEvents"] if e.get("name") == "ProfileChunk"]
        if not chunks:
            raise ValueError("trace has no ProfileChunk events (was CPU profiling on?)")
        # Pick the thread with the most chunks — the main / busiest one.
        threads = {}
        for e in chunks:
            threads.setdefault((e["pid"], e["tid"]), []).append(e)
        main = max(threads.values(), key=len)
        nodes, samples, deltas = {}, [], []
        for e in main:
            d = e["args"]["data"]
            cp = d.get("cpuProfile", {})
            for n in cp.get("nodes", []):
                nodes[n["id"]] = n
            samples += cp.get("samples", [])
            deltas += d.get("timeDeltas", [])
        return list(nodes.values()), samples, deltas

    return data["nodes"], data.get("samples"), data.get("timeDeltas")


def fold_profile(nodes, samples, deltas):
    """Node tree + samples → folded stacks weighted by sampled CPU time.

    Handles both node-link conventions: a `parent` pointer on each node (trace
    format) or a `children` list on the parent (.cpuprofile format). Falls back
    to per-node hitCount when there is no sample timeline.
    """
    parent_of, label_of = {}, {}
    for node in nodes:
        nid = node["id"]
        label_of[nid] = frame_name(node["callFrame"])
        if "parent" in node:
            parent_of[nid] = node["parent"]
        for child in node.get("children", []):
            parent_of[child] = nid

    def stack_for(nid):
        """Frame list root→leaf for a node, dropping meta frames."""
        frames, seen = [], set()
        while nid is not None and nid not in seen and nid in label_of:
            seen.add(nid)
            label = label_of[nid]
            if label not in SKIP_FRAMES:
                frames.append(label)
            nid = parent_of.get(nid)
        frames.reverse()
        return frames

    folded = {}
    if samples and deltas and len(samples) == len(deltas):
        for nid, dt in zip(samples, deltas):
            if dt <= 0:
                continue
            frames = stack_for(nid)
            if frames:
                key = tuple(frames)
                folded[key] = folded.get(key, 0) + dt
    else:
        # No timeline — weight each node by its own hitCount instead.
        for node in nodes:
            hits = node.get("hitCount", 0)
            if hits <= 0:
                continue
            frames = stack_for(node["id"])
            if frames:
                key = tuple(frames)
                folded[key] = folded.get(key, 0) + hits

    return [(list(frames), count) for frames, count in folded.items()]


def build_tree(stacks):
    """Convert flat stacks into a tree of {name → {children, self_count, total_count}}."""
    tree = {"name": "root", "children": {}, "self": 0, "total": 0}

    for frames, count in stacks:
        node = tree
        node["total"] += count
        for frame in frames:
            if frame not in node["children"]:
                node["children"][frame] = {"name": frame, "children": {}, "self": 0, "total": 0}
            node = node["children"][frame]
            node["total"] += count
        node["self"] += count

    return tree


def flatten_tree(root, max_depth=8, min_samples=1, top_n=20):
    """Flatten tree to parallel lists for go.Icicle.

    Node ids are short integers (as strings), not full slash-paths — the paths
    averaged ~230 chars each and, duplicated across ids + parents, were ~70% of
    the output JSON. Integer ids carry the same tree shape for a fraction of the
    bytes. Returns ids, labels, parents, values, depths.
    """
    ids, labels, parents, values, depths = [], [], [], [], []
    counter = [0]

    def walk(node, parent_id, depth):
        my_id = str(counter[0])
        counter[0] += 1
        ids.append(my_id)
        labels.append(node["name"])
        parents.append(parent_id)
        values.append(node["self"] if node["self"] > 0 else 0)
        depths.append(depth)
        if depth < max_depth:
            # Sort children by total descending, keep top N above the floor.
            for child in sorted(node["children"].values(), key=lambda x: x["total"], reverse=True)[:top_n]:
                if child["total"] < min_samples:
                    continue
                walk(child, my_id, depth + 1)

    walk(root, "", 0)
    return ids, labels, parents, values, depths


def synthetic_stacks():
    """Fallback web server profile so the chart always renders."""
    rows = [
        ("main;http_serve;read_request;syscall_read", 120),
        ("main;http_serve;parse_headers;malloc", 45),
        ("main;http_serve;route_dispatch;db_query;pg_exec;syscall_write", 310),
        ("main;http_serve;route_dispatch;db_query;pg_exec;hash_table_lookup", 95),
        ("main;http_serve;route_dispatch;serialize_json;malloc", 88),
        ("main;http_serve;route_dispatch;serialize_json;snprintf", 42),
        ("main;http_serve;write_response;syscall_write", 130),
        ("main;http_serve;write_response;gzip_compress;deflate", 175),
        ("main;http_serve;write_response;gzip_compress;malloc", 30),
        ("main;event_loop;epoll_wait;syscall", 200),
        ("main;event_loop;timer_tick;gc_sweep;free", 60),
        ("main;event_loop;timer_tick;gc_sweep;mark_phase", 40),
        ("main;event_loop;timer_tick;gc_mark;malloc", 20),
        ("main;tls_handshake;ssl_read;syscall_read", 50),
        ("main;tls_handshake;ssl_write;syscall_write", 35),
    ]
    return [(s.split(";"), c) for s, c in rows]


def generate():
    warnings.filterwarnings("ignore")

    profile = find_profile()
    if profile is not None:
        print(f"parsing browser profile {profile.name} …")
        nodes, samples, deltas = extract_samples(read_json(profile))
        stacks = fold_profile(nodes, samples, deltas)
        # Clean label: drop .json/.gz/.cpuprofile suffixes for the title.
        source = profile.name
        for suffix in (".gz", ".json", ".cpuprofile"):
            if source.endswith(suffix):
                source = source[: -len(suffix)]
        # Real profiles are deep and bushy. Keep plenty of structure but prune
        # the long tail of slivers (<0.25% of total) — they're invisible at this
        # size and nobody zooms in, yet they dominate the node count / bytes.
        max_depth, top_n, min_frac = 18, 50, 0.0025
    else:
        print("no profile found — using synthetic web server profile")
        stacks = synthetic_stacks()
        source = "Synthetic web server profile"
        max_depth, top_n, min_frac = 8, 20, 1 / 200

    print(f"  parsed {len(stacks)} stacks")

    tree = build_tree(stacks)
    total = tree["total"]
    ids, labels, parents, values, depths = flatten_tree(
        tree, min_samples=max(1, int(total * min_frac)), max_depth=max_depth, top_n=top_n
    )

    print(f"  tree nodes: {len(ids)}")

    # Color by depth
    colors = [VIOLET, GREEN, TEAL, PINK, TEAL]
    marker_colors = [colors[d % len(colors)] for d in depths]

    # Sampled profiles weight by time (µs → ms); the synthetic fallback is raw
    # sample counts. Carry the self-cost in display units for the hover.
    if profile is not None:
        customdata = [v / 1000 for v in values]
        unit = "ms"
    else:
        customdata = list(values)
        unit = "samples"

    fig = go.Figure(go.Icicle(
        ids=ids,
        labels=labels,
        parents=parents,
        values=values,
        customdata=customdata,
        branchvalues="remainder",
        tiling=dict(orientation="v"),  # root at top, stacks grow downward
        marker=dict(colors=marker_colors),
        textfont=dict(size=10),
        hovertemplate=(
            "<b>%{label}</b><br>Self: %{customdata:.1f} " + unit
            + "<br>%{percentRoot:.1%} of total<extra></extra>"
        ),
        maxdepth=14,
    ))

    fig.update_layout(
        title=dict(text=f"Flame Graph — {source}", x=0.5),
        margin=dict(t=60, b=20, l=0, r=0),
        height=700,
    )
    apply_theme(fig)
    return fig


fig = generate()
fig.show()
Made with Plotly