
Pulmonology flow-volume loop
normal, obstructive, and restrictive patterns
Example from the compendium of canonical charts
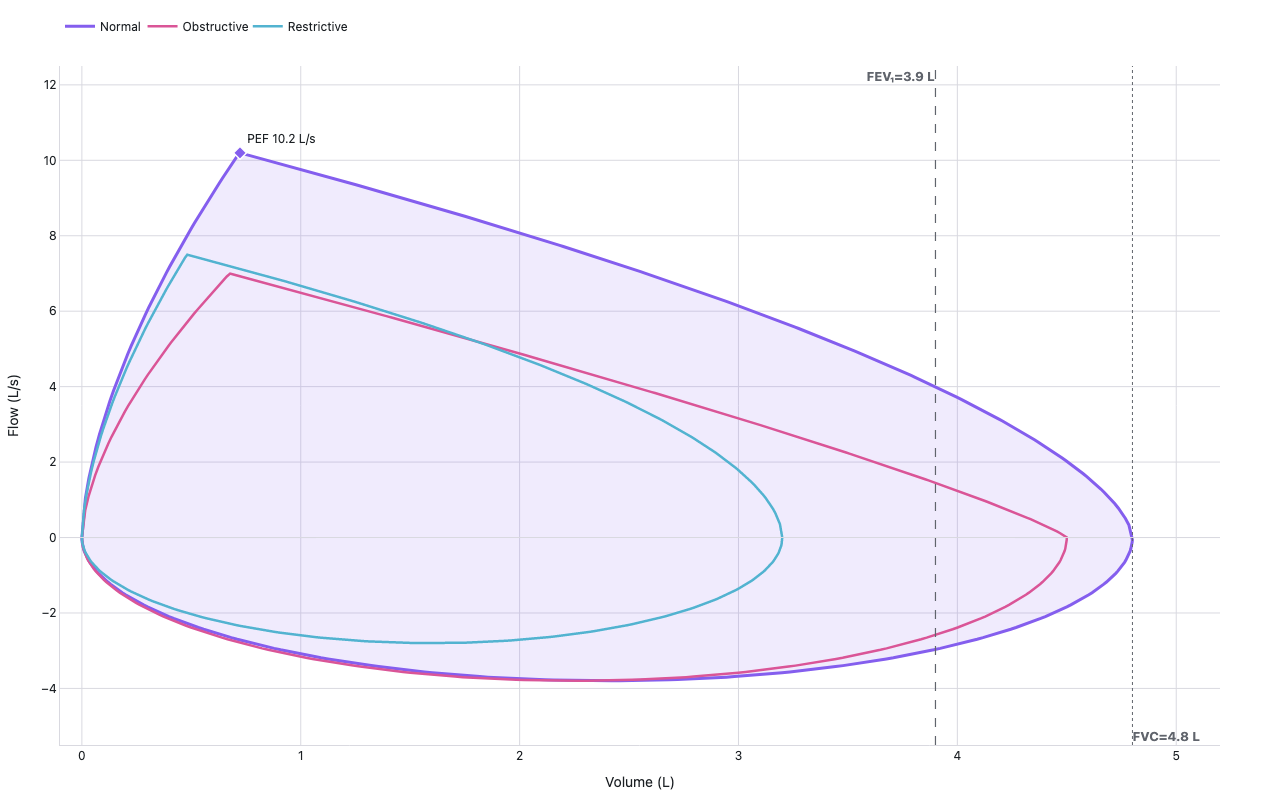
Python Code
"""Pulmonology flow-volume loop — normal, obstructive, and restrictive patterns."""
from pathlib import Path

# ── Palette + theme (matching the Plotly Studio gallery these charts ship in) ──
VIOLET, TEAL, GREEN, PINK, ORANGE = "#845EEE", "#52B3D0", "#55B685", "#DA5597", "#E9A23B"
PRIMARY, SECONDARY = VIOLET, TEAL
COLORWAY = [VIOLET, TEAL, GREEN, PINK, ORANGE]
BG, TEXT, GRID, MUTED = "#ffffff", "#1c2024", "#d9d9e0", "#60646c"
FONT = "Inter, -apple-system, BlinkMacSystemFont, sans-serif"
COLORSCALE = [[0, "rgba(132, 94, 238, 0.05)"], [1, "rgba(132, 94, 238, 0.9)"]]


def apply_theme(fig):
    """Light gallery theme: white background, Inter font, soft gridlines."""
    fig.update_layout(
        paper_bgcolor=BG, plot_bgcolor=BG, colorway=COLORWAY,
        font=dict(family=FONT, color=TEXT, size=12),
        legend=dict(font=dict(color=TEXT)),
        hoverlabel=dict(bgcolor="#f0f0f3", font=dict(color=TEXT, family=FONT), bordercolor=GRID),
    )
    fig.update_xaxes(gridcolor=GRID, linecolor=GRID, zerolinecolor=GRID)
    fig.update_yaxes(gridcolor=GRID, linecolor=GRID, zerolinecolor=GRID)


def fetch_csv(url, **kwargs):
    import io
    import pandas as pd
    import requests
    r = requests.get(url, timeout=60)
    r.raise_for_status()
    return pd.read_csv(io.StringIO(r.text), **kwargs)


def fetch_json(url):
    import requests
    r = requests.get(url, timeout=60)
    r.raise_for_status()
    return r.json()

import numpy as np
import plotly.graph_objects as go


def exp_curve(fvc, pef, concavity=0.62, n=300):
    v = np.linspace(0, fvc, n)
    pef_v = 0.15 * fvc
    flow = np.where(
        v <= pef_v,
        pef * (v / pef_v) ** 0.6,
        pef * ((fvc - v) / (fvc - pef_v)) ** concavity,
    )
    return v, np.clip(flow, 0, None)


def insp_curve(fvc, peak_insp=3.8, n=200):
    theta = np.linspace(np.pi, 0, n)
    v = fvc * (1 - np.cos(theta)) / 2
    f = -peak_insp * np.sin(theta)
    return v, f


def make_loop(fvc, pef, concavity=0.62, peak_insp=3.8):
    v_e, f_e = exp_curve(fvc, pef, concavity)
    v_i, f_i = insp_curve(fvc, peak_insp)
    return v_e, f_e, v_i, f_i


def generate():
    print("building flow-volume loops: normal, obstructive, restrictive …")

    # ── Normal reference ──────────────────────────────────────────────────────
    NRM_FVC, NRM_PEF = 4.8, 10.2
    v_ne, f_ne, v_ni, f_ni = make_loop(NRM_FVC, NRM_PEF)

    # ── Obstructive (e.g., COPD): low FEV1/FVC, concave scooped curve ────────
    OBS_FVC, OBS_PEF = 4.5, 7.0
    v_oe, f_oe, v_oi, f_oi = make_loop(OBS_FVC, OBS_PEF, concavity=0.85)

    # ── Restrictive (e.g., fibrosis): reduced FVC, normal shape/ratio ─────────
    RES_FVC, RES_PEF = 3.2, 7.5
    v_re, f_re, v_ri, f_ri = make_loop(RES_FVC, RES_PEF, concavity=0.55, peak_insp=2.8)

    fig = go.Figure()

    # Zero reference line
    fig.add_hline(y=0, line=dict(color=GRID, width=1))

    # Normal loop shaded fill (entire loop)
    all_v = np.concatenate([v_ne, v_ni[::-1]])
    all_f = np.concatenate([f_ne, f_ni[::-1]])
    fig.add_trace(go.Scatter(
        x=all_v, y=all_f,
        fill="toself",
        fillcolor="rgba(132,94,238,0.12)",
        line=dict(width=0),
        showlegend=False,
        hoverinfo="skip",
        name="Normal fill",
    ))

    # Normal curve
    fig.add_trace(go.Scatter(
        x=np.concatenate([v_ne, [v_ne[-1]], v_ni]), y=np.concatenate([f_ne, [0], f_ni]),
        mode="lines",
        name="Normal",
        line=dict(color=VIOLET, width=3),
        hovertemplate="V=%{x:.2f} L  Flow=%{y:.2f} L/s<extra></extra>",
    ))

    # Obstructive loop
    fig.add_trace(go.Scatter(
        x=np.concatenate([v_oe, [v_oe[-1]], v_oi]), y=np.concatenate([f_oe, [0], f_oi]),
        mode="lines",
        name="Obstructive",
        line=dict(color=PINK, width=2.5),
        hovertemplate="V=%{x:.2f} L  Flow=%{y:.2f} L/s<extra></extra>",
    ))

    # Restrictive loop
    fig.add_trace(go.Scatter(
        x=np.concatenate([v_re, [v_re[-1]], v_ri]), y=np.concatenate([f_re, [0], f_ri]),
        mode="lines",
        name="Restrictive",
        line=dict(color=TEAL, width=2.5),
        hovertemplate="V=%{x:.2f} L  Flow=%{y:.2f} L/s<extra></extra>",
    ))

    # PEF marker on normal curve (same color as normal line)
    pef_idx = np.argmax(f_ne)
    fig.add_trace(go.Scatter(
        x=[v_ne[pef_idx]], y=[f_ne[pef_idx]],
        mode="markers+text",
        marker=dict(color=VIOLET, size=10, symbol="diamond", line=dict(color="white", width=1.5)),
        text=[f"PEF {NRM_PEF:.1f} L/s"],
        textposition="top right",
        showlegend=False,
        hoverinfo="skip",
    ))

    # FEV1 line on normal
    NRM_FEV1 = 3.9
    fig.add_vline(
        x=NRM_FEV1,
        line=dict(color=MUTED, width=1.2, dash="dash"),
        annotation_text=f"<b>FEV₁={NRM_FEV1} L</b>",
        annotation_position="top left",
        annotation_font=dict(size=13, color=MUTED),
    )

    # FVC line on normal
    fig.add_vline(
        x=NRM_FVC,
        line=dict(color=MUTED, width=1, dash="dot"),
        annotation_text=f"<b>FVC={NRM_FVC} L</b>",
        annotation_position="bottom right",
        annotation_font=dict(size=13, color=MUTED),
    )

    fig.update_layout(
        xaxis=dict(title="Volume (L)", range=[-0.1, NRM_FVC + 0.4], zeroline=False),
        yaxis=dict(title="Flow (L/s)", range=[-5.5, 12.5], zeroline=False),
        legend=dict(orientation="h", y=1.08),
        margin=dict(t=50, b=50, l=60, r=60),
        height=480,
    )
    apply_theme(fig)
    return fig


fig = generate()
fig.show()
Made with Plotly