
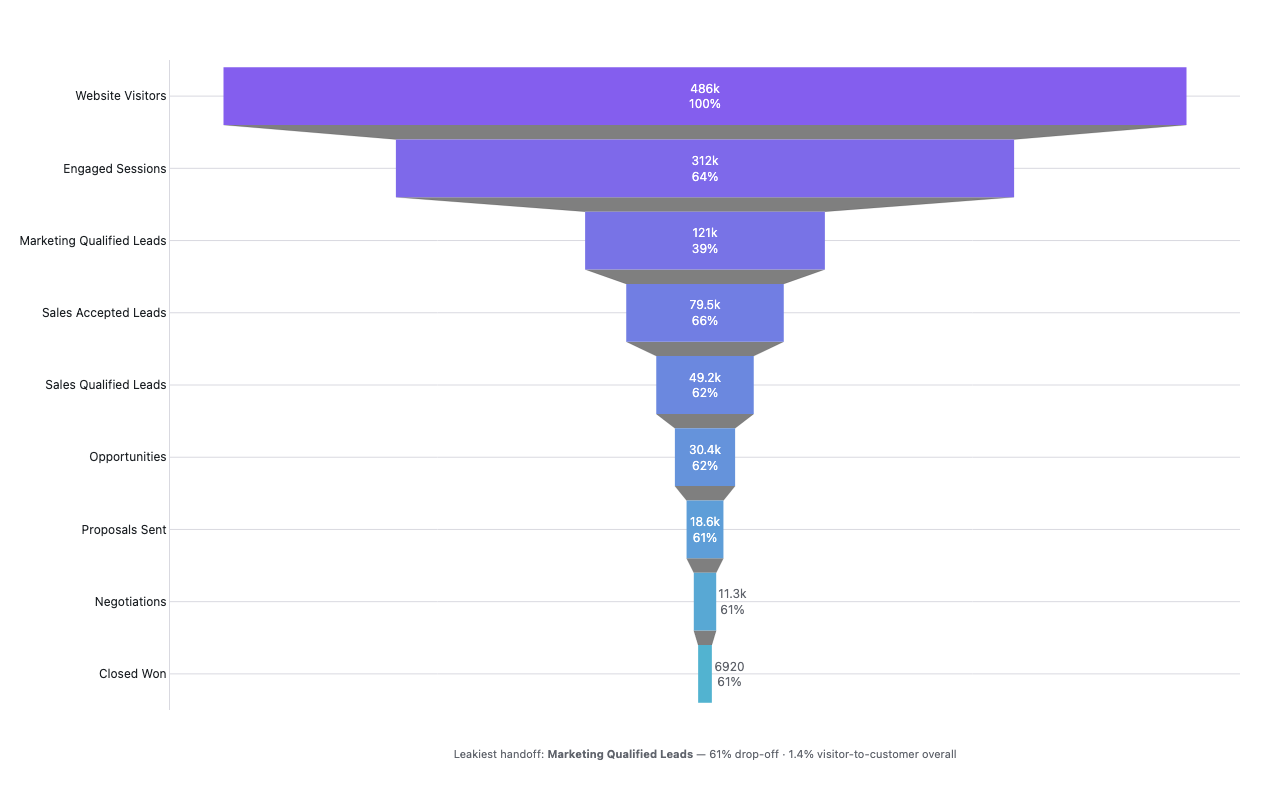
Funnel chart
B2B sales & marketing demand-generation pipeline
Example from the compendium of canonical charts
Python Code
"""Funnel chart — B2B sales & marketing demand-generation pipeline."""
from pathlib import Path

# ── Palette + theme (matching the Plotly Studio gallery these charts ship in) ──
VIOLET, TEAL, GREEN, PINK, ORANGE = "#845EEE", "#52B3D0", "#55B685", "#DA5597", "#E9A23B"
PRIMARY, SECONDARY = VIOLET, TEAL
COLORWAY = [VIOLET, TEAL, GREEN, PINK, ORANGE]
BG, TEXT, GRID, MUTED = "#ffffff", "#1c2024", "#d9d9e0", "#60646c"
FONT = "Inter, -apple-system, BlinkMacSystemFont, sans-serif"
COLORSCALE = [[0, "rgba(132, 94, 238, 0.05)"], [1, "rgba(132, 94, 238, 0.9)"]]


def apply_theme(fig):
    """Light gallery theme: white background, Inter font, soft gridlines."""
    fig.update_layout(
        paper_bgcolor=BG, plot_bgcolor=BG, colorway=COLORWAY,
        font=dict(family=FONT, color=TEXT, size=12),
        legend=dict(font=dict(color=TEXT)),
        hoverlabel=dict(bgcolor="#f0f0f3", font=dict(color=TEXT, family=FONT), bordercolor=GRID),
    )
    fig.update_xaxes(gridcolor=GRID, linecolor=GRID, zerolinecolor=GRID)
    fig.update_yaxes(gridcolor=GRID, linecolor=GRID, zerolinecolor=GRID)


def fetch_csv(url, **kwargs):
    import io
    import pandas as pd
    import requests
    r = requests.get(url, timeout=60)
    r.raise_for_status()
    return pd.read_csv(io.StringIO(r.text), **kwargs)


def fetch_json(url):
    import requests
    r = requests.get(url, timeout=60)
    r.raise_for_status()
    return r.json()

import plotly.graph_objects as go


# A representative quarter of a B2B SaaS demand-gen → revenue funnel. Nine stages
# from top-of-funnel site traffic all the way down to closed-won deals, with the
# kind of stage-to-stage conversion rates a real RevOps team would recognise
# (~60% per step, leakiest around the marketing-to-sales handoff).
STAGES = [
    ("Website Visitors",         486_000),
    ("Engaged Sessions",         312_000),
    ("Marketing Qualified Leads", 121_000),
    ("Sales Accepted Leads",      79_500),
    ("Sales Qualified Leads",     49_200),
    ("Opportunities",             30_400),
    ("Proposals Sent",            18_600),
    ("Negotiations",              11_300),
    ("Closed Won",                 6_920),
]


def gradient(c0, c1, n):
    """n hex colors interpolated from c0 to c1 (violet → teal funnel ramp)."""
    a = [int(c0[i:i + 2], 16) for i in (1, 3, 5)]
    b = [int(c1[i:i + 2], 16) for i in (1, 3, 5)]
    return [
        "#%02X%02X%02X" % tuple(
            round(a[j] + (b[j] - a[j]) * (k / (n - 1))) for j in range(3)
        )
        for k in range(n)
    ]


def generate():
    labels = [s[0] for s in STAGES]
    counts = [s[1] for s in STAGES]

    pct_prev = [100.0] + [counts[i] / counts[i - 1] * 100 for i in range(1, len(counts))]
    drops = [100 - p for p in pct_prev[1:]]
    leakiest_idx = drops.index(max(drops)) + 1
    leakiest = labels[leakiest_idx]

    pct_init = [c / counts[0] * 100 for c in counts]
    overall = pct_init[-1]
    print("stage-to-stage conversion:")
    for lbl, p in zip(labels, pct_prev):
        print(f"  {lbl:<26} {p:5.1f}%")
    print(f"  end-to-end visitor → customer: {overall:.2f}%")

    # Hand the hover its numbers as plain values via customdata — Plotly's built-in
    # %{percentInitial}/%{percentPrevious} double-apply a "%" d3 format and render
    # garbage (e.g. 6420%), so we format the percentages ourselves.
    customdata = list(zip(pct_prev, pct_init))

    fig = go.Figure(go.Funnel(
        y=labels,
        x=counts,
        customdata=customdata,
        textposition="auto",
        textinfo="value+percent previous",
        insidetextfont=dict(color="#ffffff"),
        outsidetextfont=dict(color=MUTED),
        marker=dict(color=gradient(VIOLET, TEAL, len(STAGES))),
        connector=dict(line=dict(color="rgba(0,0,0,0.12)", width=1)),
        hovertemplate=(
            "<b>%{label}</b><br>"
            "%{value:,}<br>"
            "%{customdata[0]:.0f}% of previous stage<br>"
            "%{customdata[1]:.1f}% of all visitors"
            "<extra></extra>"
        ),
    ))

    fig.add_annotation(
        x=0.5, y=-0.08, xref="paper", yref="paper",
        text=(
            f"Leakiest handoff: <b>{leakiest}</b> "
            f"— {drops[leakiest_idx - 1]:.0f}% drop-off · "
            f"{overall:.1f}% visitor-to-customer overall"
        ),
        showarrow=False,
        font=dict(size=11, color=MUTED),
    )

    fig.update_layout(
        title=dict(text="B2B Sales & Marketing Funnel", x=0.5),
        margin=dict(t=60, b=90, l=170, r=40),
        height=520,
    )
    apply_theme(fig)
    return fig


fig = generate()
fig.show()
Made with Plotly