
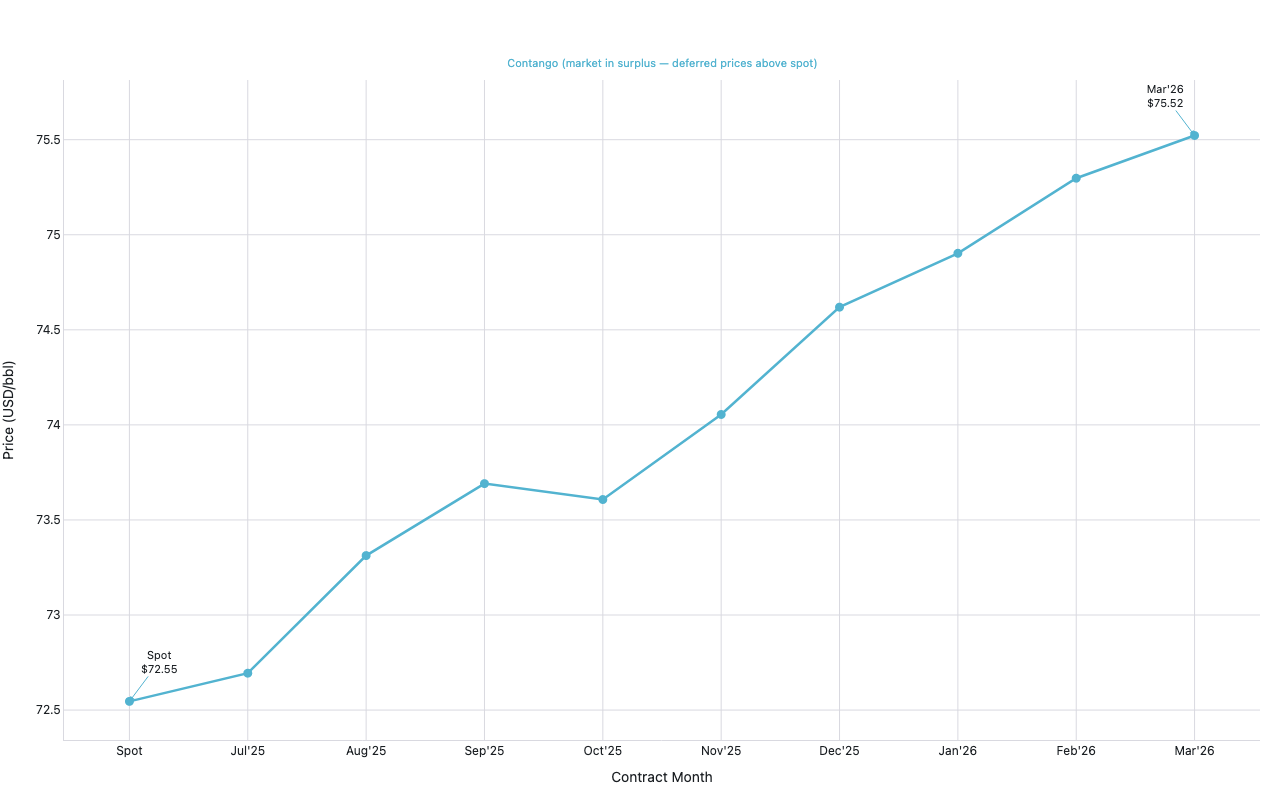
WTI Crude Oil futures term structure
Commodities — contango vs backwardation
Example from the compendium of canonical charts
Python Code
"""Commodities — WTI Crude Oil futures term structure (contango vs backwardation)."""
from pathlib import Path

# ── Palette + theme (matching the Plotly Studio gallery these charts ship in) ──
VIOLET, TEAL, GREEN, PINK, ORANGE = "#845EEE", "#52B3D0", "#55B685", "#DA5597", "#E9A23B"
PRIMARY, SECONDARY = VIOLET, TEAL
COLORWAY = [VIOLET, TEAL, GREEN, PINK, ORANGE]
BG, TEXT, GRID, MUTED = "#ffffff", "#1c2024", "#d9d9e0", "#60646c"
FONT = "Inter, -apple-system, BlinkMacSystemFont, sans-serif"
COLORSCALE = [[0, "rgba(132, 94, 238, 0.05)"], [1, "rgba(132, 94, 238, 0.9)"]]


def apply_theme(fig):
    """Light gallery theme: white background, Inter font, soft gridlines."""
    fig.update_layout(
        paper_bgcolor=BG, plot_bgcolor=BG, colorway=COLORWAY,
        font=dict(family=FONT, color=TEXT, size=12),
        legend=dict(font=dict(color=TEXT)),
        hoverlabel=dict(bgcolor="#f0f0f3", font=dict(color=TEXT, family=FONT), bordercolor=GRID),
    )
    fig.update_xaxes(gridcolor=GRID, linecolor=GRID, zerolinecolor=GRID)
    fig.update_yaxes(gridcolor=GRID, linecolor=GRID, zerolinecolor=GRID)


def fetch_csv(url, **kwargs):
    import io
    import pandas as pd
    import requests
    r = requests.get(url, timeout=60)
    r.raise_for_status()
    return pd.read_csv(io.StringIO(r.text), **kwargs)


def fetch_json(url):
    import requests
    r = requests.get(url, timeout=60)
    r.raise_for_status()
    return r.json()

import numpy as np
import pandas as pd
import plotly.graph_objects as go
import warnings
warnings.filterwarnings("ignore")


# WTI Crude contracts: try CME/NYMEX symbols
# Month codes: F=Jan G=Feb H=Mar J=Apr K=May M=Jun N=Jul Q=Aug U=Sep V=Oct X=Nov Z=Dec
CONTRACTS_NYM = [
    ("CL=F",   "Spot/Front"),
    ("CLN25.NYM", "Jul 2025"),
    ("CLQ25.NYM", "Aug 2025"),
    ("CLU25.NYM", "Sep 2025"),
    ("CLV25.NYM", "Oct 2025"),
    ("CLX25.NYM", "Nov 2025"),
    ("CLZ25.NYM", "Dec 2025"),
    ("CLF26.NYM", "Jan 2026"),
    ("CLG26.NYM", "Feb 2026"),
    ("CLH26.NYM", "Mar 2026"),
]

# Alternative symbols without suffix
CONTRACTS_ALT = [
    ("CLN25=F", "Jul 2025"),
    ("CLQ25=F", "Aug 2025"),
    ("CLU25=F", "Sep 2025"),
    ("CLV25=F", "Oct 2025"),
    ("CLX25=F", "Nov 2025"),
    ("CLZ25=F", "Dec 2025"),
    ("CLF26=F", "Jan 2026"),
    ("CLG26=F", "Feb 2026"),
]


def fetch_price(sym):
    """Try to get last closing price for a futures contract."""
    try:
        import yfinance as yf
        hist = yf.Ticker(sym).history(period="5d")["Close"].dropna()
        if len(hist) > 0:
            return float(hist.iloc[-1])
    except Exception:
        pass
    return None


def fetch_term_structure():
    """Fetch WTI term structure from yfinance."""
    try:
        import yfinance as yf
        results = []

        # Try primary symbols first
        for sym, label in CONTRACTS_NYM:
            price = fetch_price(sym)
            if price and price > 0:
                results.append({"label": label, "price": price, "symbol": sym})

        # If sparse, try alt symbols
        if len(results) < 4:
            for sym, label in CONTRACTS_ALT:
                if not any(r["label"] == label for r in results):
                    price = fetch_price(sym)
                    if price and price > 0:
                        results.append({"label": label, "price": price, "symbol": sym})

        if len(results) < 3:
            raise ValueError(f"only {len(results)} contracts found")

        # Sort by label (they're in order already)
        df = pd.DataFrame(results)
        return df

    except Exception as e:
        print(f"  futures fetch failed ({e}), using synthetic data")
        return None


def make_synthetic():
    """Synthetic WTI term structure — mild contango."""
    rng = np.random.default_rng(42)
    months = ["Spot", "Jul'25", "Aug'25", "Sep'25", "Oct'25", "Nov'25",
              "Dec'25", "Jan'26", "Feb'26", "Mar'26"]
    # Slight contango: prices rise modestly with time
    base = 72.50
    prices = [base + i * 0.35 + rng.normal(0, 0.15) for i in range(len(months))]
    return pd.DataFrame({"label": months, "price": prices})


def build_fig(df):
    prices = df["price"].tolist()
    labels = df["label"].tolist()

    # Determine market structure
    slope = (prices[-1] - prices[0]) / max(len(prices) - 1, 1)
    if slope > 0.05:
        structure = "Contango (market in surplus — deferred prices above spot)"
        line_color = TEAL
    elif slope < -0.05:
        structure = "Backwardation (tight supply — spot premium over deferred)"
        line_color = GREEN
    else:
        structure = "Flat term structure"
        line_color = VIOLET

    fig = go.Figure()

    # Shaded band between spot and last
    fig.add_trace(go.Scatter(
        x=labels, y=prices,
        mode="lines+markers",
        name="WTI Crude",
        line=dict(color=line_color, width=2.5),
        marker=dict(size=9, color=line_color, symbol="circle"),
        hovertemplate="%{x}: $%{y:.2f}/bbl<extra></extra>",
    ))

    # Annotate spot price
    fig.add_annotation(
        x=labels[0], y=prices[0],
        text=f"Spot<br>${prices[0]:.2f}",
        showarrow=True,
        arrowhead=2,
        arrowcolor=line_color,
        ax=30, ay=-40,
        font=dict(size=11),
    )

    # Annotate farthest contract
    fig.add_annotation(
        x=labels[-1], y=prices[-1],
        text=f"{labels[-1]}<br>${prices[-1]:.2f}",
        showarrow=True,
        arrowhead=2,
        arrowcolor=line_color,
        ax=-30, ay=-40,
        font=dict(size=11),
    )

    fig.add_annotation(
        x=0.5, y=1.04,
        xref="paper", yref="paper",
        text=structure,
        showarrow=False,
        font=dict(size=11, color=line_color),
        align="center",
    )

    fig.update_layout(
        xaxis_title="Contract Month",
        yaxis_title="Price (USD/bbl)",
        showlegend=False,
        margin=dict(t=80, b=60, l=60, r=20),
    )
    return fig


def generate():
    df = fetch_term_structure()
    if df is None or len(df) < 3:
        df = make_synthetic()
        print("  using synthetic WTI term structure")
    else:
        print(f"  fetched {len(df)} WTI contracts from yfinance")

    fig = build_fig(df)
    apply_theme(fig)
    return fig


fig = generate()
fig.show()
Made with Plotly