
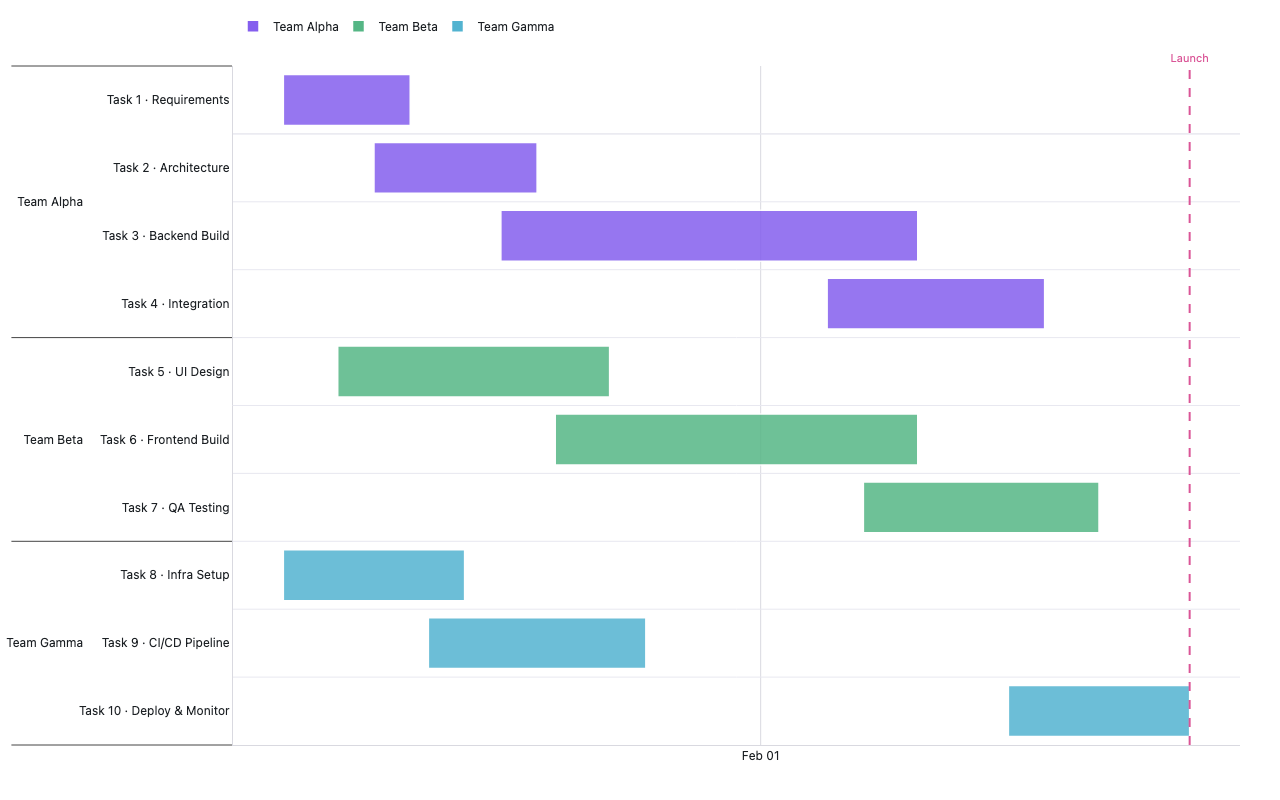
Gantt chart
fabricated software project with multicategory team/task axes
Example from the compendium of canonical charts
Python Code
"""Gantt chart — fabricated software project with multicategory team/task axes."""
from pathlib import Path

# ── Palette + theme (matching the Plotly Studio gallery these charts ship in) ──
VIOLET, TEAL, GREEN, PINK, ORANGE = "#845EEE", "#52B3D0", "#55B685", "#DA5597", "#E9A23B"
PRIMARY, SECONDARY = VIOLET, TEAL
COLORWAY = [VIOLET, TEAL, GREEN, PINK, ORANGE]
BG, TEXT, GRID, MUTED = "#ffffff", "#1c2024", "#d9d9e0", "#60646c"
FONT = "Inter, -apple-system, BlinkMacSystemFont, sans-serif"
COLORSCALE = [[0, "rgba(132, 94, 238, 0.05)"], [1, "rgba(132, 94, 238, 0.9)"]]


def apply_theme(fig):
    """Light gallery theme: white background, Inter font, soft gridlines."""
    fig.update_layout(
        paper_bgcolor=BG, plot_bgcolor=BG, colorway=COLORWAY,
        font=dict(family=FONT, color=TEXT, size=12),
        legend=dict(font=dict(color=TEXT)),
        hoverlabel=dict(bgcolor="#f0f0f3", font=dict(color=TEXT, family=FONT), bordercolor=GRID),
    )
    fig.update_xaxes(gridcolor=GRID, linecolor=GRID, zerolinecolor=GRID)
    fig.update_yaxes(gridcolor=GRID, linecolor=GRID, zerolinecolor=GRID)


def fetch_csv(url, **kwargs):
    import io
    import pandas as pd
    import requests
    r = requests.get(url, timeout=60)
    r.raise_for_status()
    return pd.read_csv(io.StringIO(r.text), **kwargs)


def fetch_json(url):
    import requests
    r = requests.get(url, timeout=60)
    r.raise_for_status()
    return r.json()

import pandas as pd
import numpy as np
import plotly.graph_objects as go


# Fabricated 10-week sprint plan
# [team, task_name, start_day, end_day, color_key]
TASKS = [
    # Team Alpha
    ("Team Alpha", "Task 1 · Requirements",    0,  7,  VIOLET),
    ("Team Alpha", "Task 2 · Architecture",    5, 14,  VIOLET),
    ("Team Alpha", "Task 3 · Backend Build",  12, 35,  VIOLET),
    ("Team Alpha", "Task 4 · Integration",    30, 42,  VIOLET),
    # Team Beta
    ("Team Beta",  "Task 5 · UI Design",       3, 18,  GREEN),
    ("Team Beta",  "Task 6 · Frontend Build", 15, 35,  GREEN),
    ("Team Beta",  "Task 7 · QA Testing",     32, 45,  GREEN),
    # Team Gamma
    ("Team Gamma", "Task 8 · Infra Setup",     0, 10,  TEAL),
    ("Team Gamma", "Task 9 · CI/CD Pipeline",  8, 20,  TEAL),
    ("Team Gamma", "Task 10 · Deploy & Monitor",40, 50, TEAL),
]

START_DATE = pd.Timestamp("2025-01-06")  # Monday


def generate():
    print("building fabricated multicategory Gantt chart …")

    rows = []
    for team, task, d0, d1, color in TASKS:
        rows.append({
            "team": team,
            "task": task,
            "start": START_DATE + pd.Timedelta(days=d0),
            "end":   START_DATE + pd.Timedelta(days=d1),
            "color": color,
        })
    df = pd.DataFrame(rows)

    # Multicategory y-axis: [team, task] pairs (task 1 at top → reversed order)
    y_labels = [[row["team"], row["task"]] for _, row in df.iterrows()]

    fig = go.Figure()

    # One trace per team for legend grouping
    teams = ["Team Alpha", "Team Beta", "Team Gamma"]
    team_colors = [VIOLET, GREEN, TEAL]

    for team, color in zip(teams, team_colors):
        sub = df[df["team"] == team]
        for _, row in sub.iterrows():
            duration_ms = (row["end"] - row["start"]).total_seconds() * 1000
            fig.add_trace(go.Bar(
                x=[duration_ms],
                y=[[row["team"], row["task"]]],
                base=[row["start"].value // 10**6],  # ms timestamp
                orientation="h",
                marker=dict(color=color, opacity=0.85,
                            line=dict(color="white", width=1.5)),
                name=team,
                legendgroup=team,
                showlegend=bool(row.name == sub.index[0]),  # show once per team
                hovertemplate=(
                    f"<b>{row['task']}</b><br>"
                    f"{row['start'].strftime('%b %d')} – {row['end'].strftime('%b %d')}<br>"
                    f"{(row['end'] - row['start']).days} days<extra></extra>"
                ),
            ))

    # Milestone marker: launch day
    launch = START_DATE + pd.Timedelta(days=50)
    fig.add_vline(
        x=launch.value // 10**6,
        line=dict(color=PINK, width=2, dash="dash"),
        annotation_text="Launch",
        annotation_position="top",
        annotation_font=dict(size=11, color=PINK),
    )

    fig.update_layout(
        barmode="overlay",
        xaxis=dict(
            title="",
            type="date",
            showgrid=True,
            dtick="M1",
            tickformat="%b %d",
        ),
        yaxis=dict(
            autorange="reversed",
            type="multicategory",
            showgrid=True,
            gridcolor="#e8e8f0",
        ),
        legend=dict(orientation="h", y=1.08),
        bargap=0.25,
        margin=dict(t=50, b=50, l=20, r=40),
        height=480,
    )
    apply_theme(fig)
    return fig


fig = generate()
fig.show()
Made with Plotly