
Growing-degree-day (GDD) accumulation for corn, 2021-2023
Agronomy
Example from the compendium of canonical charts
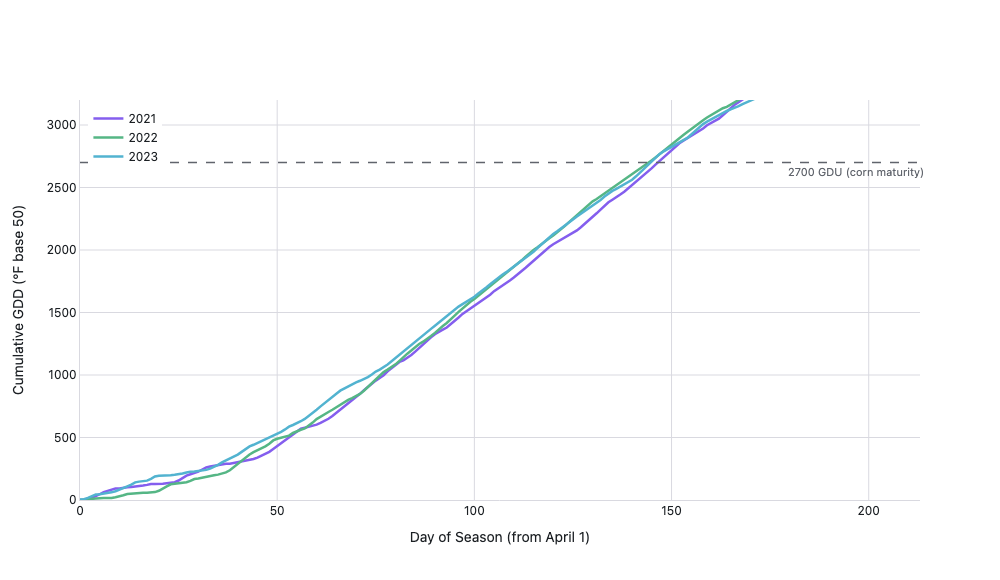
Python Code
"""Agronomy — Growing-degree-day (GDD) accumulation for corn, 2021-2023."""
from pathlib import Path

# ── Palette + theme (matching the Plotly Studio gallery these charts ship in) ──
VIOLET, TEAL, GREEN, PINK, ORANGE = "#845EEE", "#52B3D0", "#55B685", "#DA5597", "#E9A23B"
PRIMARY, SECONDARY = VIOLET, TEAL
COLORWAY = [VIOLET, TEAL, GREEN, PINK, ORANGE]
BG, TEXT, GRID, MUTED = "#ffffff", "#1c2024", "#d9d9e0", "#60646c"
FONT = "Inter, -apple-system, BlinkMacSystemFont, sans-serif"
COLORSCALE = [[0, "rgba(132, 94, 238, 0.05)"], [1, "rgba(132, 94, 238, 0.9)"]]


def apply_theme(fig):
    """Light gallery theme: white background, Inter font, soft gridlines."""
    fig.update_layout(
        paper_bgcolor=BG, plot_bgcolor=BG, colorway=COLORWAY,
        font=dict(family=FONT, color=TEXT, size=12),
        legend=dict(font=dict(color=TEXT)),
        hoverlabel=dict(bgcolor="#f0f0f3", font=dict(color=TEXT, family=FONT), bordercolor=GRID),
    )
    fig.update_xaxes(gridcolor=GRID, linecolor=GRID, zerolinecolor=GRID)
    fig.update_yaxes(gridcolor=GRID, linecolor=GRID, zerolinecolor=GRID)


def fetch_csv(url, **kwargs):
    import io
    import pandas as pd
    import requests
    r = requests.get(url, timeout=60)
    r.raise_for_status()
    return pd.read_csv(io.StringIO(r.text), **kwargs)


def fetch_json(url):
    import requests
    r = requests.get(url, timeout=60)
    r.raise_for_status()
    return r.json()

import numpy as np
import pandas as pd
import plotly.graph_objects as go


# Champaign-Urbana, IL (corn country)
LAT, LON = 40.11, -88.21
YEARS = [2021, 2022, 2023]
COLORS = [VIOLET, GREEN, TEAL]

BASE_URL = (
    "https://archive-api.open-meteo.com/v1/archive"
    "?latitude={lat}&longitude={lon}"
    "&start_date={start}&end_date={end}"
    "&daily=temperature_2m_max,temperature_2m_min"
    "&temperature_unit=fahrenheit"
    "&timezone=America%2FChicago"
)

def gdd_corn(tmax, tmin):
    """GDD for corn with 50°F base and 86°F ceiling."""
    tmax_capped = min(tmax, 86)
    tmin_floored = max(tmin, 50)
    return max(0.0, (tmax_capped + tmin_floored) / 2.0 - 50.0)


def generate():
    fig = go.Figure()

    for year, color in zip(YEARS, COLORS):
        start = f"{year}-04-01"
        end = f"{year}-10-31"
        url = BASE_URL.format(lat=LAT, lon=LON, start=start, end=end)

        try:
            data = fetch_json(url)
            daily = data["daily"]
            tmax_arr = daily["temperature_2m_max"]
            tmin_arr = daily["temperature_2m_min"]
            print(f"{year}: {len(tmax_arr)} days")

            gdds = []
            for tmax, tmin in zip(tmax_arr, tmin_arr):
                if tmax is None or tmin is None:
                    gdds.append(np.nan)
                else:
                    gdds.append(gdd_corn(float(tmax), float(tmin)))

            gdds = np.array(gdds, dtype=float)
            cum_gdd = np.nancumsum(gdds)
            day_of_season = np.arange(len(cum_gdd))

        except Exception as e:
            print(f"API failed for {year} ({e}), using synthetic")
            day_of_season = np.arange(213)
            daily_gdd = np.maximum(0, 18 * np.sin(np.pi * day_of_season / 213) ** 1.5)
            scale = {2021: 1.02, 2022: 0.96, 2023: 1.00}[year]
            daily_gdd *= scale
            cum_gdd = np.cumsum(daily_gdd)

        fig.add_trace(go.Scatter(
            x=day_of_season,
            y=cum_gdd,
            mode="lines",
            name=str(year),
            line=dict(color=color, width=2.5),
        ))

    fig.add_hline(y=2700, line_dash="dash", line_color=MUTED, line_width=1.5,
                  annotation_text="2700 GDU (corn maturity)",
                  annotation_position="bottom right",
                  annotation_font=dict(size=11, color=MUTED))

    fig.update_layout(
        xaxis=dict(title="Day of Season (from April 1)", range=[0, 213]),
        yaxis=dict(title="Cumulative GDD (°F base 50)", range=[0, 3200]),
        legend=dict(x=0.01, y=0.99),
    )

    apply_theme(fig)
    return fig


fig = generate()
fig.show()
Made with Plotly