
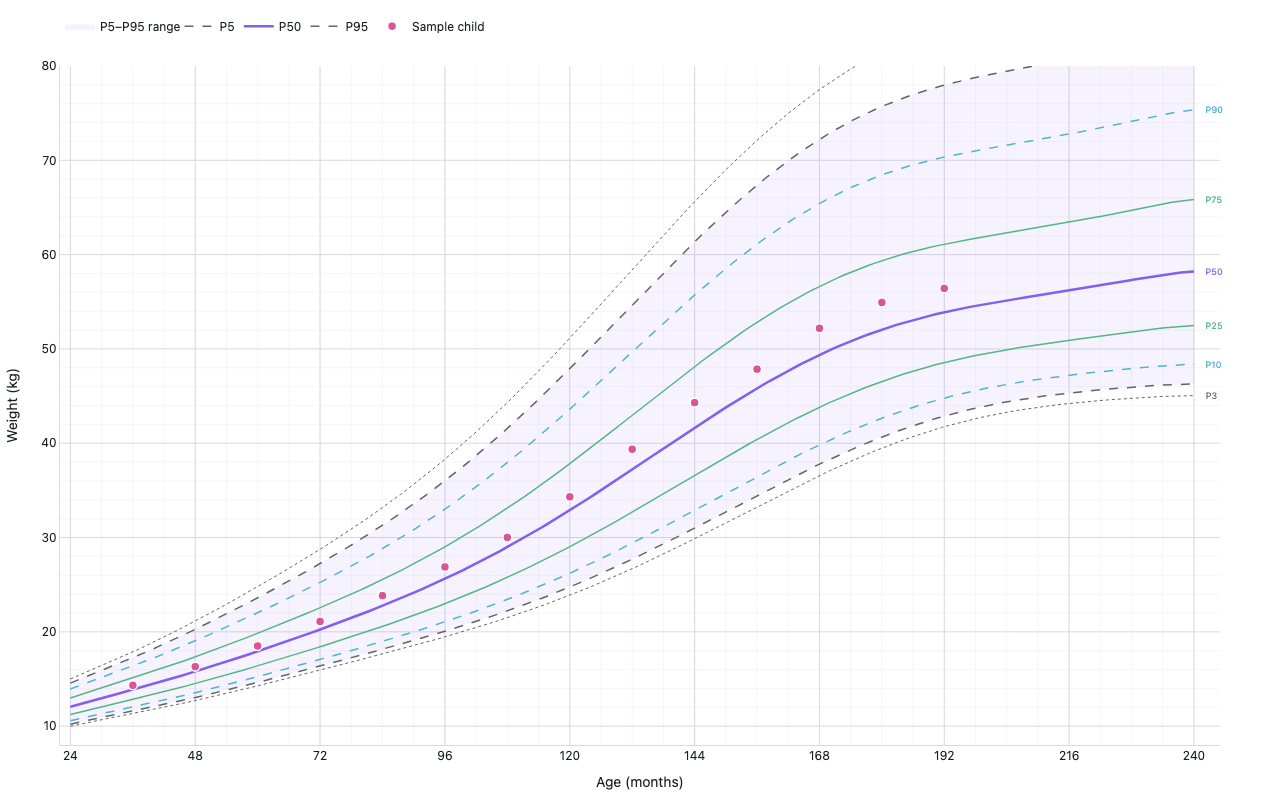
Pediatrics growth chart
CDC LMS weight-for-age percentile curves, girls 2–20 years
Example from the compendium of canonical charts
Python Code
"""Pediatrics growth chart — CDC LMS weight-for-age percentile curves, girls 2–20 years."""
from pathlib import Path

# ── Palette + theme (matching the Plotly Studio gallery these charts ship in) ──
VIOLET, TEAL, GREEN, PINK, ORANGE = "#845EEE", "#52B3D0", "#55B685", "#DA5597", "#E9A23B"
PRIMARY, SECONDARY = VIOLET, TEAL
COLORWAY = [VIOLET, TEAL, GREEN, PINK, ORANGE]
BG, TEXT, GRID, MUTED = "#ffffff", "#1c2024", "#d9d9e0", "#60646c"
FONT = "Inter, -apple-system, BlinkMacSystemFont, sans-serif"
COLORSCALE = [[0, "rgba(132, 94, 238, 0.05)"], [1, "rgba(132, 94, 238, 0.9)"]]


def apply_theme(fig):
    """Light gallery theme: white background, Inter font, soft gridlines."""
    fig.update_layout(
        paper_bgcolor=BG, plot_bgcolor=BG, colorway=COLORWAY,
        font=dict(family=FONT, color=TEXT, size=12),
        legend=dict(font=dict(color=TEXT)),
        hoverlabel=dict(bgcolor="#f0f0f3", font=dict(color=TEXT, family=FONT), bordercolor=GRID),
    )
    fig.update_xaxes(gridcolor=GRID, linecolor=GRID, zerolinecolor=GRID)
    fig.update_yaxes(gridcolor=GRID, linecolor=GRID, zerolinecolor=GRID)


def fetch_csv(url, **kwargs):
    import io
    import pandas as pd
    import requests
    r = requests.get(url, timeout=60)
    r.raise_for_status()
    return pd.read_csv(io.StringIO(r.text), **kwargs)


def fetch_json(url):
    import requests
    r = requests.get(url, timeout=60)
    r.raise_for_status()
    return r.json()

import numpy as np
import pandas as pd
import plotly.graph_objects as go


WTAGE_URL  = "https://www.cdc.gov/growthcharts/data/zscore/wtage.csv"

# Percentile columns and their display labels
PCTS = ["P3", "P5", "P10", "P25", "P50", "P75", "P90", "P95", "P97"]

# Line styles: outer percentiles thin/dashed, inner thicker, median bold
PCT_STYLES = {
    "P3":  dict(color=MUTED,   width=1,   dash="dot"),
    "P5":  dict(color=MUTED,   width=1.5, dash="dash"),
    "P10": dict(color=TEAL,    width=1.5, dash="dash"),
    "P25": dict(color=GREEN,   width=1.5),
    "P50": dict(color=VIOLET,  width=2.5),
    "P75": dict(color=GREEN,   width=1.5),
    "P90": dict(color=TEAL,    width=1.5, dash="dash"),
    "P95": dict(color=MUTED,   width=1.5, dash="dash"),
    "P97": dict(color=MUTED,   width=1,   dash="dot"),
}


def generate():
    print("fetching CDC weight-for-age LMS table …")
    try:
        df = fetch_csv(WTAGE_URL)
        df.columns = [c.strip() for c in df.columns]
        print(f"  cols: {list(df.columns[:8])}")
    except Exception as e:
        print(f"  fetch failed ({e}), using synthetic percentiles")
        df = None

    # Filter: female (Sex==2), ages 24–240 months
    if df is not None:
        df["Sex"] = pd.to_numeric(df.get("Sex", df.get("sex", pd.Series([]))), errors="coerce")
        df["Agemos"] = pd.to_numeric(df.get("Agemos", df.get("agemos", pd.Series([]))), errors="coerce")
        for p in PCTS:
            df[p] = pd.to_numeric(df[p], errors="coerce")
        df = df[(df["Sex"] == 2) & (df["Agemos"] >= 24) & (df["Agemos"] <= 240)].copy()
        df = df.sort_values("Agemos").reset_index(drop=True)
        if len(df) < 10:
            df = None

    if df is None:
        # Synthetic CDC-like weight-for-age percentiles (girls 24-240 months)
        ages = np.arange(24, 241)
        # Approximate CDC values using a growth model
        # Reference median ~13 kg at 24 mo, ~58 kg at 240 mo
        def wt_pct(age_mo, z):
            # LMS-based approximation for girls
            m = 11.5 * (age_mo / 24) ** 0.42
            s = 0.14
            l = -0.1
            return m * (1 + l * s * z) ** (1 / l)

        z_vals = {"P3": -1.88, "P5": -1.645, "P10": -1.28, "P25": -0.674,
                  "P50": 0, "P75": 0.674, "P90": 1.28, "P95": 1.645, "P97": 1.88}
        df = pd.DataFrame({"Agemos": ages})
        for p, z in z_vals.items():
            df[p] = wt_pct(ages, z)

    ages = df["Agemos"].values

    fig = go.Figure()

    # Shaded band: P5 to P95
    fig.add_trace(go.Scatter(
        x=np.concatenate([ages, ages[::-1]]),
        y=np.concatenate([df["P95"].values, df["P5"].values[::-1]]),
        fill="toself",
        fillcolor="rgba(132, 94, 238, 0.07)",
        line=dict(width=0),
        name="P5–P95 range",
        hoverinfo="skip",
        showlegend=True,
    ))

    # Percentile lines
    for p in PCTS:
        style = PCT_STYLES[p]
        show_in_legend = p in ("P5", "P50", "P95")
        fig.add_trace(go.Scatter(
            x=ages,
            y=df[p].values,
            mode="lines",
            name=p,
            line=style,
            showlegend=show_in_legend,
            hovertemplate=f"{p}: %{{y:.1f}} kg at %{{x:.0f}} mo<extra></extra>",
        ))

    # Percentile labels at right edge
    for p in ["P3", "P10", "P25", "P50", "P75", "P90", "P97"]:
        last_y = df[p].values[-1]
        fig.add_annotation(
            x=242, y=last_y,
            text=p, showarrow=False,
            font=dict(size=9, color=PCT_STYLES[p]["color"]),
            xanchor="left",
        )

    # Sample child: annual well-child visits from age 3 to 16 (36–192 months)
    # Tracking between P50 and P75 with realistic visit-to-visit variation
    sample_ages = np.array([36, 48, 60, 72, 84, 96, 108, 120, 132, 144, 156, 168, 180, 192])
    rng = np.random.default_rng(37)
    idx_df = df.set_index("Agemos")
    p50 = idx_df["P50"].reindex(sample_ages).values
    p75 = idx_df["P75"].reindex(sample_ages).values
    frac = np.clip(0.35 + rng.normal(0, 0.04, len(sample_ages)), 0.1, 0.7)
    sample_wts = p50 + frac * (p75 - p50)

    fig.add_trace(go.Scatter(
        x=sample_ages,
        y=sample_wts,
        mode="markers+lines",
        name="Sample child",
        marker=dict(color=PINK, size=9, symbol="circle",
                    line=dict(color="white", width=1.5)),
        line=dict(color=PINK, width=2.5, dash="dot"),
        hovertemplate="Age %{x} mo: %{y:.1f} kg<extra></extra>",
    ))

    fig.update_layout(
        xaxis=dict(
            title="Age (months)",
            tickvals=list(range(24, 241, 24)),
            ticktext=[str(m) for m in range(24, 241, 24)],
            range=[22, 245],
        ),
        yaxis=dict(title="Weight (kg)", range=[8, 80]),
        legend=dict(orientation="h", y=1.08),
        margin=dict(t=50, b=50, l=60, r=60),
        height=500,
    )
    apply_theme(fig)
    return fig


fig = generate()
fig.show()
Made with Plotly