
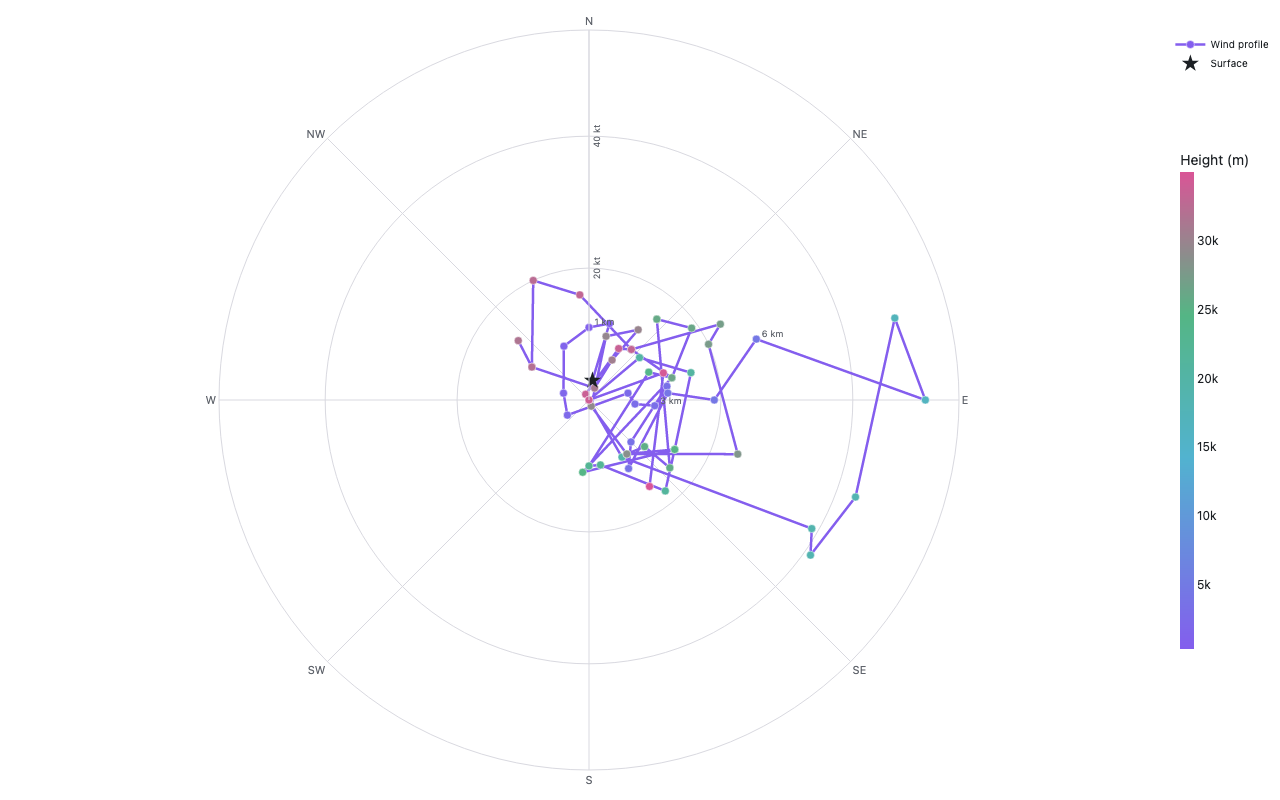
Hodograph
Meteorology — upper-air wind profile, OUN sounding
Example from the compendium of canonical charts
Python Code
"""Meteorology — Hodograph (upper-air wind profile, OUN sounding)."""
from pathlib import Path

# ── Palette + theme (matching the Plotly Studio gallery these charts ship in) ──
VIOLET, TEAL, GREEN, PINK, ORANGE = "#845EEE", "#52B3D0", "#55B685", "#DA5597", "#E9A23B"
PRIMARY, SECONDARY = VIOLET, TEAL
COLORWAY = [VIOLET, TEAL, GREEN, PINK, ORANGE]
BG, TEXT, GRID, MUTED = "#ffffff", "#1c2024", "#d9d9e0", "#60646c"
FONT = "Inter, -apple-system, BlinkMacSystemFont, sans-serif"
COLORSCALE = [[0, "rgba(132, 94, 238, 0.05)"], [1, "rgba(132, 94, 238, 0.9)"]]


def apply_theme(fig):
    """Light gallery theme: white background, Inter font, soft gridlines."""
    fig.update_layout(
        paper_bgcolor=BG, plot_bgcolor=BG, colorway=COLORWAY,
        font=dict(family=FONT, color=TEXT, size=12),
        legend=dict(font=dict(color=TEXT)),
        hoverlabel=dict(bgcolor="#f0f0f3", font=dict(color=TEXT, family=FONT), bordercolor=GRID),
    )
    fig.update_xaxes(gridcolor=GRID, linecolor=GRID, zerolinecolor=GRID)
    fig.update_yaxes(gridcolor=GRID, linecolor=GRID, zerolinecolor=GRID)


def fetch_csv(url, **kwargs):
    import io
    import pandas as pd
    import requests
    r = requests.get(url, timeout=60)
    r.raise_for_status()
    return pd.read_csv(io.StringIO(r.text), **kwargs)


def fetch_json(url):
    import requests
    r = requests.get(url, timeout=60)
    r.raise_for_status()
    return r.json()

import numpy as np
import plotly.graph_objects as go


URL = "https://mesonet.agron.iastate.edu/json/raob.py?station=OUN&ts=2024051200"


def load_sounding():
    try:
        data = fetch_json(URL)
        # API returns either 'soundings' or 'profiles' depending on version
        if "soundings" in data:
            profile = data["soundings"][0]["profile"]
        elif "profiles" in data:
            profile = data["profiles"][0]["profile"]
        else:
            raise KeyError(f"unexpected keys: {list(data.keys())}")
        print(f"  profile length: {len(profile)}")
        print(f"  sample keys: {list(profile[0].keys()) if profile else 'empty'}")
        return profile
    except Exception as e:
        print(f"  data load failed ({e})")
        return None


def generate():
    profile = load_sounding()
    synthetic = False

    if profile is not None:
        hght_list, drct_list, sknt_list = [], [], []
        for lvl in profile:
            h = lvl.get("hght")
            d = lvl.get("drct")
            s = lvl.get("sknt")
            if h is not None and d is not None and s is not None:
                try:
                    hght_list.append(float(h))
                    drct_list.append(float(d))
                    sknt_list.append(float(s))
                except (ValueError, TypeError):
                    pass

        HGHT = np.array(hght_list)
        DRCT = np.array(drct_list)
        SKNT = np.array(sknt_list)
        print(f"  valid levels: {len(HGHT)}, height range: {HGHT.min():.0f}–{HGHT.max():.0f} m")
    else:
        synthetic = True
        print("  using synthetic hodograph (severe-storm environment)")
        # Synthetic supercell hodograph
        HGHT = np.array([0, 500, 1000, 1500, 2000, 3000, 4000, 5000, 6000, 8000, 10000, 12000])
        DRCT = np.array([180, 200, 220, 240, 260, 280, 300, 310, 320, 330, 340, 350])
        SKNT = np.array([10, 18, 28, 38, 45, 52, 58, 62, 65, 68, 70, 72])

    # Convert to u, v components (meteorological convention)
    d_rad = DRCT * np.pi / 180
    u = -SKNT * np.sin(d_rad)
    v = -SKNT * np.cos(d_rad)

    fig = go.Figure()

    # Concentric range rings
    for r in [20, 40, 60, 80]:
        theta = np.linspace(0, 2 * np.pi, 200)
        fig.add_trace(go.Scatter(
            x=r * np.cos(theta),
            y=r * np.sin(theta),
            mode="lines",
            line=dict(color="#e0e0e8", width=1),
            showlegend=False,
            hoverinfo="skip",
        ))
        # Ring labels
        fig.add_annotation(
            x=r, y=2,
            text=f"{r} kt",
            showarrow=False,
            font=dict(size=8, color=MUTED),
        )

    # Hodograph trace — colored by height
    # Use a multi-segment approach with per-segment color
    fig.add_trace(go.Scatter(
        x=u,
        y=v,
        mode="lines+markers",
        name="Wind profile" + (" (synthetic)" if synthetic else ""),
        line=dict(color=VIOLET, width=2.5),
        marker=dict(
            color=HGHT,
            colorscale="Plasma",
            size=8,
            showscale=True,
            colorbar=dict(
                title="Height (m)",
                thickness=14,
                len=0.7,
            ),
            line=dict(color="white", width=0.5),
        ),
        hovertemplate=(
            "U=%{x:.1f} kt<br>"
            "V=%{y:.1f} kt<br>"
            "Height=%{marker.color:.0f} m<extra></extra>"
        ),
    ))

    # Label a few key levels
    for target_h in [1000, 3000, 6000]:
        idx = np.argmin(np.abs(HGHT - target_h))
        fig.add_annotation(
            x=u[idx],
            y=v[idx],
            text=f"  {target_h // 1000}km",
            showarrow=False,
            font=dict(size=9, color=MUTED),
        )

    # Surface marker
    fig.add_trace(go.Scatter(
        x=[u[0]],
        y=[v[0]],
        mode="markers",
        marker=dict(symbol="star", size=12, color="#E9A23B"),
        name="Surface",
        hovertemplate=f"SFC: U={u[0]:.1f}, V={v[0]:.1f} kt<extra></extra>",
    ))

    # Axis extents
    all_pts = np.concatenate([np.abs(u), np.abs(v)])
    r_max = max(float(np.nanmax(all_pts)) * 1.1, 40)

    fig.update_layout(
        xaxis=dict(
            title="U-component (kt)",
            range=[-r_max, r_max],
            zeroline=True,
            zerolinewidth=1.5,
            zerolinecolor="#888",
            scaleanchor="y",
            constrain="domain",
        ),
        yaxis=dict(
            title="V-component (kt)",
            range=[-r_max, r_max],
            zeroline=True,
            zerolinewidth=1.5,
            zerolinecolor="#888",
            constrain="domain",
        ),
        legend=dict(
            x=1.12, y=1.0,
            xanchor="left",
            font=dict(size=10),
        ),
        margin=dict(t=20, b=60, l=70, r=140),
    )

    apply_theme(fig)
    return fig


fig = generate()
fig.show()
Made with Plotly