
Hurricane track + spaghetti from HURDAT2
Meteorology
Example from the compendium of canonical charts
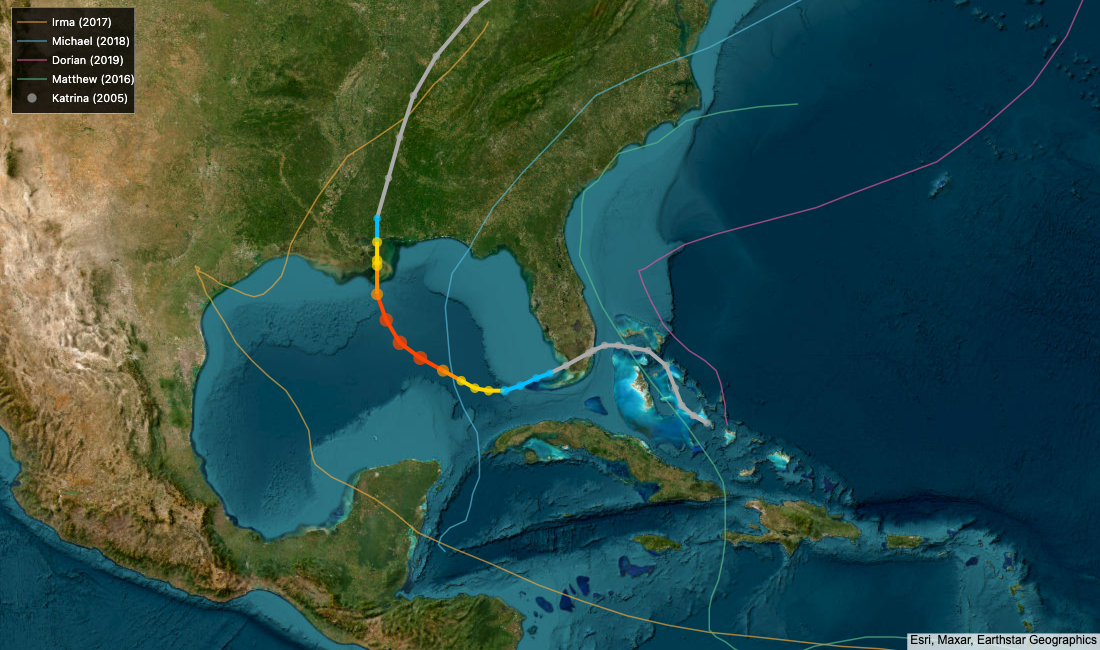
Python Code
"""Meteorology — Hurricane track + spaghetti from HURDAT2."""
from pathlib import Path

# ── Palette + theme (matching the Plotly Studio gallery these charts ship in) ──
VIOLET, TEAL, GREEN, PINK, ORANGE = "#845EEE", "#52B3D0", "#55B685", "#DA5597", "#E9A23B"
PRIMARY, SECONDARY = VIOLET, TEAL
COLORWAY = [VIOLET, TEAL, GREEN, PINK, ORANGE]
BG, TEXT, GRID, MUTED = "#ffffff", "#1c2024", "#d9d9e0", "#60646c"
FONT = "Inter, -apple-system, BlinkMacSystemFont, sans-serif"
COLORSCALE = [[0, "rgba(132, 94, 238, 0.05)"], [1, "rgba(132, 94, 238, 0.9)"]]


def apply_theme(fig):
    """Light gallery theme: white background, Inter font, soft gridlines."""
    fig.update_layout(
        paper_bgcolor=BG, plot_bgcolor=BG, colorway=COLORWAY,
        font=dict(family=FONT, color=TEXT, size=12),
        legend=dict(font=dict(color=TEXT)),
        hoverlabel=dict(bgcolor="#f0f0f3", font=dict(color=TEXT, family=FONT), bordercolor=GRID),
    )
    fig.update_xaxes(gridcolor=GRID, linecolor=GRID, zerolinecolor=GRID)
    fig.update_yaxes(gridcolor=GRID, linecolor=GRID, zerolinecolor=GRID)


def fetch_csv(url, **kwargs):
    import io
    import pandas as pd
    import requests
    r = requests.get(url, timeout=60)
    r.raise_for_status()
    return pd.read_csv(io.StringIO(r.text), **kwargs)


def fetch_json(url):
    import requests
    r = requests.get(url, timeout=60)
    r.raise_for_status()
    return r.json()

import numpy as np
import pandas as pd
import plotly.graph_objects as go
import io, requests, warnings


HURDAT_URL = "https://www.nhc.noaa.gov/data/hurdat/hurdat2-1851-2023-051124.txt"

TARGETS = {
    "AL122005": ("Katrina (2005)", VIOLET, 3.5),
    "AL092017": ("Irma (2017)",    ORANGE, 1.5),
    "AL142018": ("Michael (2018)", TEAL,   1.5),
    "AL092019": ("Dorian (2019)",  PINK,   1.5),
    "AL142016": ("Matthew (2016)", GREEN,  1.5),
}

SYNTHETIC_STORMS = {
    "AL122005": pd.DataFrame({
        "lat": [23.1, 24.5, 25.7, 26.1, 26.9, 27.1, 26.7, 26.2, 26.9, 28.2,
                29.5, 29.9, 29.2, 28.5],
        "lon": [-75.1, -76.5, -77.2, -78.8, -80.2, -81.5, -82.3, -83.5, -85.1,
                -86.3, -87.9, -88.9, -89.6, -90.1],
        "wind": [35, 55, 75, 80, 100, 90, 110, 130, 145, 155, 160, 150, 110, 70],
    }),
    "AL092017": pd.DataFrame({
        "lat": [16.4, 17.9, 19.1, 20.3, 22.0, 23.5, 24.8, 25.9, 25.5, 24.7,
                25.5, 26.8, 28.2],
        "lon": [-31.5, -34.1, -37.5, -41.3, -45.8, -50.0, -55.5, -61.1, -64.0,
                -67.2, -72.8, -78.3, -82.5],
        "wind": [30, 55, 80, 105, 130, 150, 165, 180, 175, 155, 130, 110, 90],
    }),
    "AL142018": pd.DataFrame({
        "lat": [19.0, 20.5, 22.1, 23.9, 26.2, 28.5, 30.1],
        "lon": [-86.7, -87.3, -87.9, -87.6, -86.5, -85.8, -85.1],
        "wind": [35, 60, 90, 115, 135, 145, 115],
    }),
    "AL092019": pd.DataFrame({
        "lat": [24.2, 25.1, 26.0, 26.5, 26.5, 26.6, 27.3, 28.2, 29.5, 31.2],
        "lon": [-73.0, -74.5, -75.7, -76.9, -78.0, -79.8, -80.5, -80.3, -79.3, -78.2],
        "wind": [45, 70, 100, 135, 155, 160, 145, 125, 105, 85],
    }),
    "AL142016": pd.DataFrame({
        "lat": [13.5, 14.9, 16.5, 18.1, 20.5, 22.8, 25.1, 27.2, 28.9, 31.1, 33.2],
        "lon": [-57.2, -59.5, -63.0, -66.4, -70.5, -73.8, -75.5, -77.1, -78.5, -79.9, -81.0],
        "wind": [35, 55, 80, 110, 135, 145, 130, 115, 120, 110, 70],
    }),
}


def parse_hurdat(text):
    storms = {}
    current_id = None
    records = []
    for line in text.strip().split("\n"):
        parts = [p.strip() for p in line.split(",")]
        if len(parts) >= 3 and parts[0].startswith("AL"):
            if current_id and records:
                storms[current_id] = pd.DataFrame(
                    records, columns=["date", "time", "record", "status",
                                      "lat", "lon", "wind", "pressure"])
            current_id = parts[0]
            records = []
        elif current_id and len(parts) >= 8:
            try:
                lat_s = parts[4]
                lon_s = parts[5]
                lat = float(lat_s[:-1]) * (1 if lat_s[-1] == "N" else -1)
                lon = float(lon_s[:-1]) * (-1 if lon_s[-1] == "W" else 1)
                wind = int(parts[6])
                pressure = int(parts[7]) if parts[7].strip() else 0
                records.append([parts[0], parts[1], parts[2], parts[3],
                                 lat, lon, wind, pressure])
            except (ValueError, IndexError):
                pass
    if current_id and records:
        storms[current_id] = pd.DataFrame(
            records, columns=["date", "time", "record", "status",
                               "lat", "lon", "wind", "pressure"])
    return storms


def wind_to_category(w):
    if w >= 157: return "#8B0000"
    if w >= 130: return "#FF4500"
    if w >= 111: return "#FF8C00"
    if w >= 96:  return "#FFD700"
    if w >= 74:  return "#00BFFF"
    return "#AAAAAA"


def generate():
    print("building hurricane track + spaghetti …")
    warnings.filterwarnings("ignore")

    storms = {}
    try:
        requests.packages.urllib3.disable_warnings()
        r = requests.get(HURDAT_URL, verify=False, timeout=60)
        r.raise_for_status()
        storms = parse_hurdat(r.text)
        print(f"  loaded {len(storms)} storms; Katrina: {'AL122005' in storms}")
    except Exception as e:
        print(f"  HURDAT failed ({e}), using synthetic tracks")
        storms = SYNTHETIC_STORMS

    fig = go.Figure()

    spaghetti_ids = [sid for sid in TARGETS if sid != "AL122005"]
    for sid in spaghetti_ids:
        if sid not in storms:
            continue
        df_s = storms[sid]
        label, color, width = TARGETS[sid]
        fig.add_trace(go.Scattermapbox(
            lat=df_s["lat"].tolist(),
            lon=df_s["lon"].tolist(),
            mode="lines",
            line=dict(color=color, width=width),
            opacity=0.7,
            name=label,
            hoverinfo="name",
        ))

    katrina = storms.get("AL122005")
    if katrina is not None and len(katrina) > 1:
        kat_lat  = katrina["lat"].tolist()
        kat_lon  = katrina["lon"].tolist()
        kat_wind = katrina["wind"].tolist()
        for i in range(len(kat_lat) - 1):
            w = (kat_wind[i] + kat_wind[i+1]) / 2
            fig.add_trace(go.Scattermapbox(
                lat=[kat_lat[i], kat_lat[i+1]],
                lon=[kat_lon[i], kat_lon[i+1]],
                mode="lines",
                line=dict(color=wind_to_category(w), width=4),
                showlegend=False,
                hoverinfo="skip",
            ))
        fig.add_trace(go.Scattermapbox(
            lat=kat_lat,
            lon=kat_lon,
            mode="markers",
            marker=dict(
                size=[max(8, w / 10) for w in kat_wind],
                color=[wind_to_category(w) for w in kat_wind],
            ),
            name="Katrina (2005)",
            hovertemplate="Lat: %{lat:.1f}°<br>Lon: %{lon:.1f}°<br>Wind: %{customdata} kt<extra></extra>",
            customdata=kat_wind,
        ))

    # Apply the gallery theme first so the legend-font override below survives
    # (save() would otherwise re-theme the legend text to the dark theme color,
    # leaving it illegible on the dark legend panel).
    apply_theme(fig)

    # Satellite basemap — ESRI World Imagery raster tiles over a blank base
    # (no Mapbox token required).
    fig.update_layout(
        mapbox=dict(
            style="white-bg",
            layers=[dict(
                below="traces",
                sourcetype="raster",
                sourceattribution="Esri, Maxar, Earthstar Geographics",
                source=[
                    "https://server.arcgisonline.com/ArcGIS/rest/services/"
                    "World_Imagery/MapServer/tile/{z}/{y}/{x}"
                ],
            )],
            center=dict(lat=27, lon=-82),
            zoom=4.0,
        ),
        legend=dict(
            x=0.01, y=0.99,
            font=dict(size=11, color="#ffffff"),
            bgcolor="rgba(0,0,0,0.78)",
            bordercolor="rgba(255,255,255,0.35)",
            borderwidth=1,
        ),
        margin=dict(t=0, b=0, l=0, r=0),
    )
    apply_theme(fig)
    return fig


fig = generate()
fig.show()
Made with Plotly