
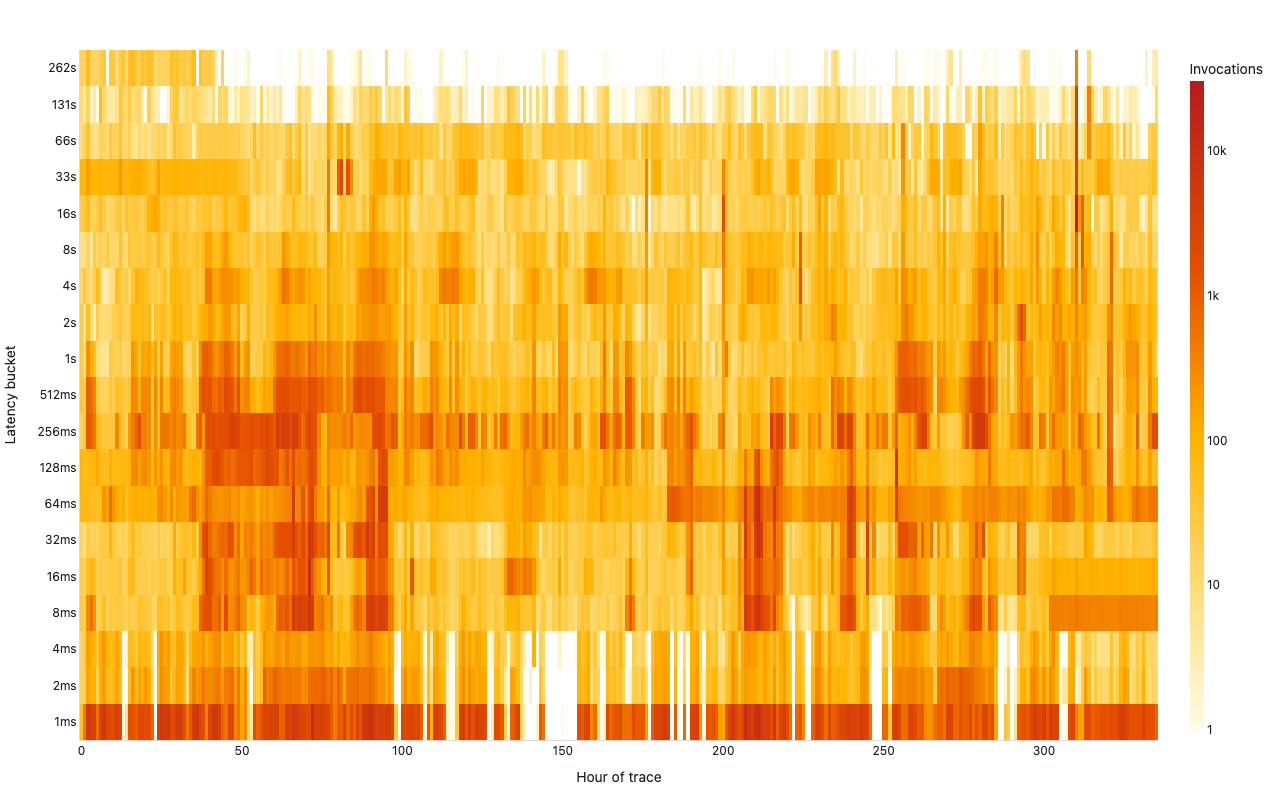
Latency heatmap
Azure Functions 2021 invocation trace (real data, Brendan Gregg style)
Example from the compendium of canonical charts
Python Code
"""Latency heatmap — Azure Functions 2021 invocation trace (real data, Brendan Gregg style)."""
from pathlib import Path

# ── Palette + theme (matching the Plotly Studio gallery these charts ship in) ──
VIOLET, TEAL, GREEN, PINK, ORANGE = "#845EEE", "#52B3D0", "#55B685", "#DA5597", "#E9A23B"
PRIMARY, SECONDARY = VIOLET, TEAL
COLORWAY = [VIOLET, TEAL, GREEN, PINK, ORANGE]
BG, TEXT, GRID, MUTED = "#ffffff", "#1c2024", "#d9d9e0", "#60646c"
FONT = "Inter, -apple-system, BlinkMacSystemFont, sans-serif"
COLORSCALE = [[0, "rgba(132, 94, 238, 0.05)"], [1, "rgba(132, 94, 238, 0.9)"]]


def apply_theme(fig):
    """Light gallery theme: white background, Inter font, soft gridlines."""
    fig.update_layout(
        paper_bgcolor=BG, plot_bgcolor=BG, colorway=COLORWAY,
        font=dict(family=FONT, color=TEXT, size=12),
        legend=dict(font=dict(color=TEXT)),
        hoverlabel=dict(bgcolor="#f0f0f3", font=dict(color=TEXT, family=FONT), bordercolor=GRID),
    )
    fig.update_xaxes(gridcolor=GRID, linecolor=GRID, zerolinecolor=GRID)
    fig.update_yaxes(gridcolor=GRID, linecolor=GRID, zerolinecolor=GRID)


def fetch_csv(url, **kwargs):
    import io
    import pandas as pd
    import requests
    r = requests.get(url, timeout=60)
    r.raise_for_status()
    return pd.read_csv(io.StringIO(r.text), **kwargs)


def fetch_json(url):
    import requests
    r = requests.get(url, timeout=60)
    r.raise_for_status()
    return r.json()

import numpy as np
import pandas as pd
import plotly.graph_objects as go
import requests, warnings, subprocess, tempfile, os


# Azure Functions "two weeks of January 2021" per-invocation trace.
# Columns: app, func, end_timestamp (s), duration (s). ~2M rows, RAR5-compressed.
RAR_URL = "https://raw.githubusercontent.com/Azure/AzurePublicDataset/master/data/AzureFunctionsInvocationTraceForTwoWeeksJan2021.rar"

# log2-spaced latency buckets, 1ms … ~262s (covers the full real range).
LOG2_EDGES = 2.0 ** np.arange(0, 20)   # 1 … 524288 ms


def bucket_label(ms):
    return f"{ms:.0f}ms" if ms < 1000 else f"{ms / 1000:.0f}s"


def load_trace():
    """Download + extract the RAR5 trace with `unar`, return the invocation DataFrame."""
    warnings.filterwarnings("ignore")
    requests.packages.urllib3.disable_warnings()

    if not subprocess.run(["which", "unar"], capture_output=True).stdout.strip():
        raise RuntimeError("`unar` not found — install it (brew install unar) to extract the RAR5 trace")

    with tempfile.TemporaryDirectory() as tmpdir:
        rar_path = os.path.join(tmpdir, "trace.rar")
        print("  downloading Azure Functions 2021 trace …")
        r = requests.get(RAR_URL, verify=False, timeout=180, stream=True)
        r.raise_for_status()
        with open(rar_path, "wb") as f:
            for chunk in r.iter_content(1 << 20):
                f.write(chunk)
        print(f"  downloaded {os.path.getsize(rar_path)/1e6:.1f}MB, extracting …")

        result = subprocess.run(["unar", "-o", tmpdir, rar_path], capture_output=True, timeout=180)
        if result.returncode != 0:
            raise RuntimeError(f"unar failed: {result.stderr.decode()[:200]}")

        # The archive holds a single comma-delimited .txt (not .csv).
        data_files = [f for f in os.listdir(tmpdir) if f.endswith((".txt", ".csv"))]
        if not data_files:
            raise RuntimeError(f"no data file in archive: {os.listdir(tmpdir)}")
        return pd.read_csv(os.path.join(tmpdir, data_files[0]))


def generate():
    print("building latency heatmap …")
    df = load_trace()

    dur_ms = np.clip(df["duration"].values * 1000.0, LOG2_EDGES[0], LOG2_EDGES[-1] * 0.999)
    hour = (df["end_timestamp"].values // 3600).astype(int)
    n_hours = hour.max() + 1
    lat_bin = np.digitize(dur_ms, LOG2_EDGES) - 1   # 0 … len(edges)-2

    n_lat = len(LOG2_EDGES) - 1
    counts = np.zeros((n_lat, n_hours))
    np.add.at(counts, (lat_bin, hour), 1)

    # Counts span 1 … ~660k, so colour on a log scale; keep raw counts for hover.
    z = np.where(counts > 0, np.log10(counts), np.nan)
    labels = [bucket_label(ms) for ms in LOG2_EDGES[:-1]]

    colorscale = [
        [0.0,  "#fffde7"],
        [0.2,  "#ffe082"],
        [0.45, "#ffb300"],
        [0.7,  "#e65100"],
        [1.0,  "#b71c1c"],
    ]

    fig = go.Figure(go.Heatmap(
        z=z,
        x=list(range(n_hours)),
        y=labels,
        customdata=counts,
        colorscale=colorscale,
        showscale=True,
        colorbar=dict(
            title="Invocations",
            thickness=14,
            tickvals=[0, 1, 2, 3, 4, 5],
            ticktext=["1", "10", "100", "1k", "10k", "100k"],
        ),
        hovertemplate="Hour %{x}<br>Latency %{y}<br>%{customdata:.0f} invocations<extra></extra>",
    ))

    fig.update_layout(
        xaxis=dict(title="Hour of trace", showgrid=False),
        yaxis=dict(title="Latency bucket", showgrid=False),
        margin=dict(t=50, b=60, l=80, r=80),
        height=420,
    )
    apply_theme(fig)
    return fig


fig = generate()
fig.show()
Made with Plotly