
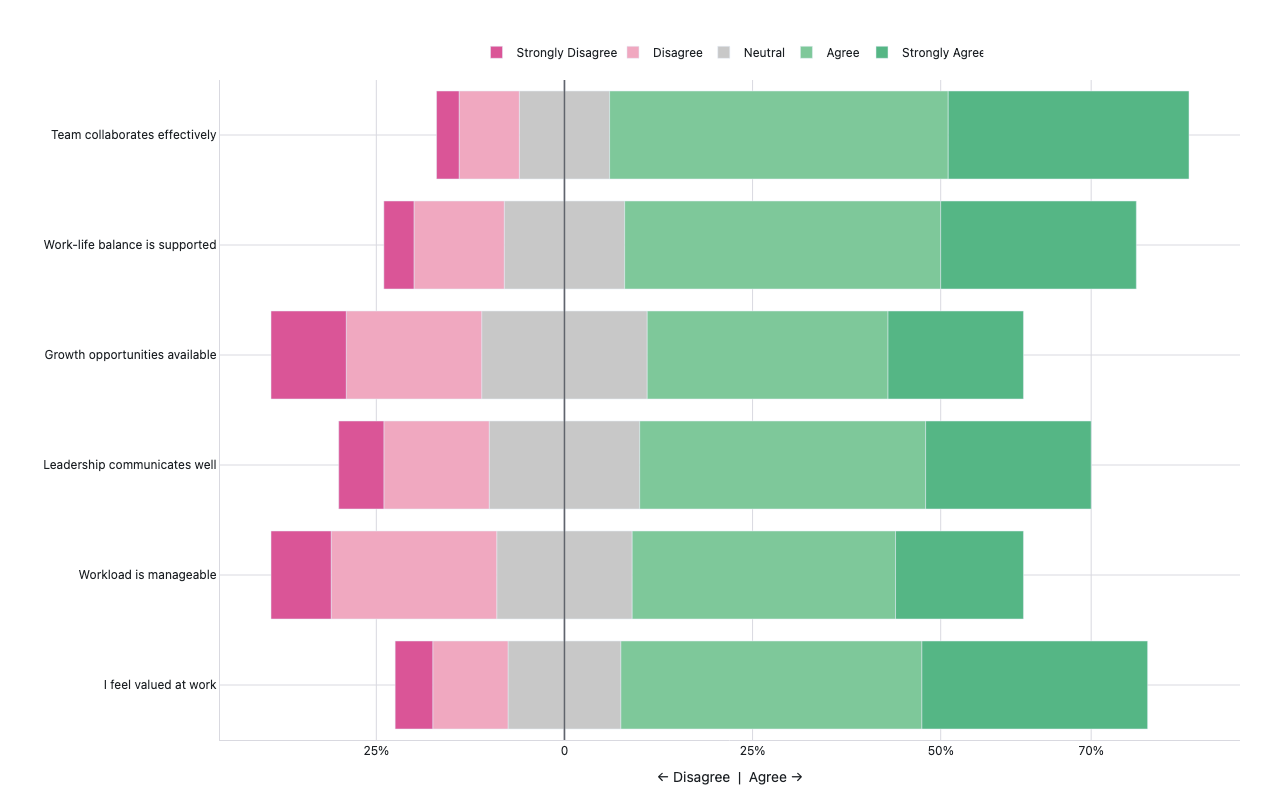
Diverging Likert bar chart
Market Research — workplace satisfaction survey
Example from the compendium of canonical charts
Python Code
"""Market Research — Diverging Likert bar chart (workplace satisfaction survey)."""
from pathlib import Path

# ── Palette + theme (matching the Plotly Studio gallery these charts ship in) ──
VIOLET, TEAL, GREEN, PINK, ORANGE = "#845EEE", "#52B3D0", "#55B685", "#DA5597", "#E9A23B"
PRIMARY, SECONDARY = VIOLET, TEAL
COLORWAY = [VIOLET, TEAL, GREEN, PINK, ORANGE]
BG, TEXT, GRID, MUTED = "#ffffff", "#1c2024", "#d9d9e0", "#60646c"
FONT = "Inter, -apple-system, BlinkMacSystemFont, sans-serif"
COLORSCALE = [[0, "rgba(132, 94, 238, 0.05)"], [1, "rgba(132, 94, 238, 0.9)"]]


def apply_theme(fig):
    """Light gallery theme: white background, Inter font, soft gridlines."""
    fig.update_layout(
        paper_bgcolor=BG, plot_bgcolor=BG, colorway=COLORWAY,
        font=dict(family=FONT, color=TEXT, size=12),
        legend=dict(font=dict(color=TEXT)),
        hoverlabel=dict(bgcolor="#f0f0f3", font=dict(color=TEXT, family=FONT), bordercolor=GRID),
    )
    fig.update_xaxes(gridcolor=GRID, linecolor=GRID, zerolinecolor=GRID)
    fig.update_yaxes(gridcolor=GRID, linecolor=GRID, zerolinecolor=GRID)


def fetch_csv(url, **kwargs):
    import io
    import pandas as pd
    import requests
    r = requests.get(url, timeout=60)
    r.raise_for_status()
    return pd.read_csv(io.StringIO(r.text), **kwargs)


def fetch_json(url):
    import requests
    r = requests.get(url, timeout=60)
    r.raise_for_status()
    return r.json()

import plotly.graph_objects as go


# Hardcoded 5-point Likert survey (n=500): employee engagement statements
# Each entry: (statement, [SD%, D%, N%, A%, SA%]) — sums to 100
SURVEY = [
    ("I feel valued at work",          [5, 10, 15, 40, 30]),
    ("Workload is manageable",         [8, 22, 18, 35, 17]),
    ("Leadership communicates well",   [6, 14, 20, 38, 22]),
    ("Growth opportunities available", [10, 18, 22, 32, 18]),
    ("Work-life balance is supported", [4, 12, 16, 42, 26]),
    ("Team collaborates effectively",  [3,  8, 12, 45, 32]),
]

LEVEL_COLORS = {
    "Strongly Disagree": PINK,
    "Disagree":          "#f0a8c0",
    "Neutral":           "#c8c8c8",
    "Agree":             "#7ec89a",
    "Strongly Agree":    GREEN,
}


def generate():
    print("building diverging Likert chart (hardcoded workplace survey) …")

    items = [row[0] for row in SURVEY]
    sd = [row[1][0] for row in SURVEY]
    dg = [row[1][1] for row in SURVEY]
    nt = [row[1][2] for row in SURVEY]
    ag = [row[1][3] for row in SURVEY]
    sa = [row[1][4] for row in SURVEY]

    nt_half = [v / 2 for v in nt]

    fig = go.Figure()

    # Left side (negative x): Neutral-half closest to center, D next, SD outermost.
    # Neutral is split so its center lands on zero.
    fig.add_trace(go.Bar(
        y=items, x=[-v for v in nt_half], orientation="h",
        name="Neutral", marker_color=LEVEL_COLORS["Neutral"],
        legendrank=3, showlegend=False,
        hovertemplate="%{y}: %{customdata:.0f}% Neutral<extra></extra>",
        customdata=nt,
    ))
    fig.add_trace(go.Bar(
        y=items, x=[-v for v in dg], orientation="h",
        name="Disagree", marker_color=LEVEL_COLORS["Disagree"],
        legendrank=2,
        hovertemplate="%{y}: %{customdata:.0f}% Disagree<extra></extra>",
        customdata=dg,
    ))
    fig.add_trace(go.Bar(
        y=items, x=[-v for v in sd], orientation="h",
        name="Strongly Disagree", marker_color=LEVEL_COLORS["Strongly Disagree"],
        legendrank=1,
        hovertemplate="%{y}: %{customdata:.0f}% Strongly Disagree<extra></extra>",
        customdata=sd,
    ))

    # Right side (positive x): Neutral-half closest to center, then Agree, SA outermost.
    fig.add_trace(go.Bar(
        y=items, x=nt_half, orientation="h",
        name="Neutral", marker_color=LEVEL_COLORS["Neutral"],
        legendrank=3,
        hovertemplate="%{y}: %{customdata:.0f}% Neutral<extra></extra>",
        customdata=nt,
    ))
    fig.add_trace(go.Bar(
        y=items, x=ag, orientation="h",
        name="Agree", marker_color=LEVEL_COLORS["Agree"],
        legendrank=4,
        hovertemplate="%{y}: %{customdata:.0f}% Agree<extra></extra>",
        customdata=ag,
    ))
    fig.add_trace(go.Bar(
        y=items, x=sa, orientation="h",
        name="Strongly Agree", marker_color=LEVEL_COLORS["Strongly Agree"],
        legendrank=5,
        hovertemplate="%{y}: %{customdata:.0f}% Strongly Agree<extra></extra>",
        customdata=sa,
    ))

    fig.add_vline(x=0, line=dict(color=MUTED, width=1.5))

    fig.update_layout(
        barmode="relative",
        xaxis=dict(
            title="← Disagree  |  Agree →",
            tickvals=[-70, -50, -25, 0, 25, 50, 70],
            ticktext=["70%", "50%", "25%", "0", "25%", "50%", "70%"],
        ),
        yaxis=dict(title=""),
        legend=dict(orientation="h", yanchor="bottom", y=1.02, xanchor="center", x=0.5),
        margin=dict(t=80, b=60, l=220, r=40),
        height=420,
    )
    apply_theme(fig)
    return fig


fig = generate()
fig.show()
Made with Plotly