
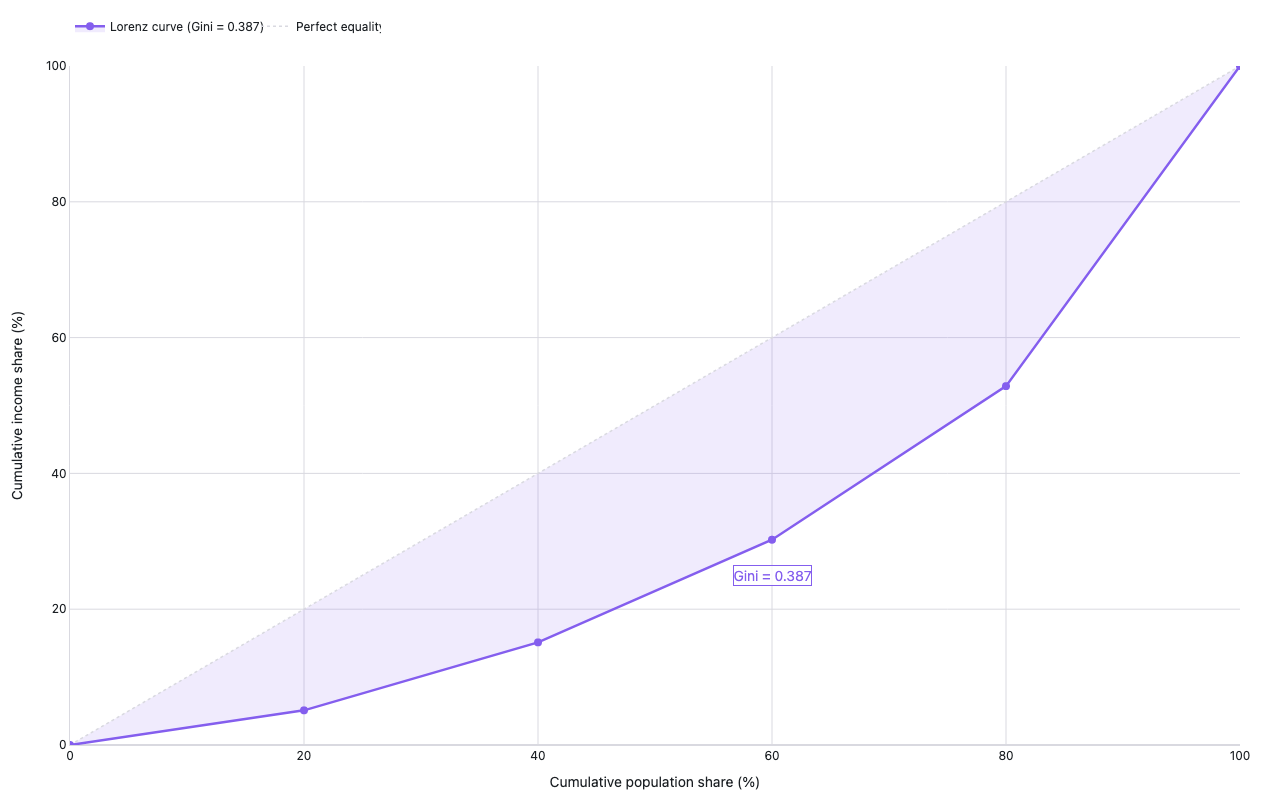
Lorenz curve + Gini coefficient
World Bank US income quintile shares
Example from the compendium of canonical charts
Python Code
"""Lorenz curve + Gini coefficient — World Bank US income quintile shares."""
from pathlib import Path

# ── Palette + theme (matching the Plotly Studio gallery these charts ship in) ──
VIOLET, TEAL, GREEN, PINK, ORANGE = "#845EEE", "#52B3D0", "#55B685", "#DA5597", "#E9A23B"
PRIMARY, SECONDARY = VIOLET, TEAL
COLORWAY = [VIOLET, TEAL, GREEN, PINK, ORANGE]
BG, TEXT, GRID, MUTED = "#ffffff", "#1c2024", "#d9d9e0", "#60646c"
FONT = "Inter, -apple-system, BlinkMacSystemFont, sans-serif"
COLORSCALE = [[0, "rgba(132, 94, 238, 0.05)"], [1, "rgba(132, 94, 238, 0.9)"]]


def apply_theme(fig):
    """Light gallery theme: white background, Inter font, soft gridlines."""
    fig.update_layout(
        paper_bgcolor=BG, plot_bgcolor=BG, colorway=COLORWAY,
        font=dict(family=FONT, color=TEXT, size=12),
        legend=dict(font=dict(color=TEXT)),
        hoverlabel=dict(bgcolor="#f0f0f3", font=dict(color=TEXT, family=FONT), bordercolor=GRID),
    )
    fig.update_xaxes(gridcolor=GRID, linecolor=GRID, zerolinecolor=GRID)
    fig.update_yaxes(gridcolor=GRID, linecolor=GRID, zerolinecolor=GRID)


def fetch_csv(url, **kwargs):
    import io
    import pandas as pd
    import requests
    r = requests.get(url, timeout=60)
    r.raise_for_status()
    return pd.read_csv(io.StringIO(r.text), **kwargs)


def fetch_json(url):
    import requests
    r = requests.get(url, timeout=60)
    r.raise_for_status()
    return r.json()

import numpy as np
import plotly.graph_objects as go
import requests, warnings

WB_BASE = "https://api.worldbank.org/v2/country/USA/indicator/{indicator}?format=json&date=2018:2023&mrv=1"

INDICATORS = {
    "Q1 (bottom 20%)": "SI.DST.FRST.20",
    "Q2":               "SI.DST.02ND.20",
    "Q3":               "SI.DST.03RD.20",
    "Q4":               "SI.DST.04TH.20",
    "Q5 (top 20%)":    "SI.DST.05TH.20",
}


def fetch_latest(indicator):
    warnings.filterwarnings("ignore")
    requests.packages.urllib3.disable_warnings()
    url = WB_BASE.format(indicator=indicator)
    r = requests.get(url, verify=False, timeout=30)
    r.raise_for_status()
    data = r.json()
    for entry in data[1]:
        if entry.get("value") is not None:
            return float(entry["value"]), entry.get("date", "?")
    return None, None


def generate():
    print("fetching World Bank US income quintile shares …")
    shares = []
    year_label = "?"
    failed = False
    for label, ind in INDICATORS.items():
        try:
            val, yr = fetch_latest(ind)
        except Exception as e:
            print(f"  World Bank API failed ({e}); using synthetic quintiles")
            failed = True
            break
        if val is None:
            print(f"  WARNING: {label} returned None — using synthetic quintiles")
            failed = True
            break
        shares.append(val)
        year_label = yr
        print(f"  {label}: {val:.1f}% ({yr})")
    if failed:
        shares = [3.1, 8.3, 14.8, 23.0, 50.8]   # approximate US 2022
        year_label = "2022 (synthetic)"

    shares = np.array(shares)
    shares = shares / shares.sum() * 100   # normalize to 100%

    # Lorenz curve: cumulative income share vs cumulative population share
    pop_shares  = np.array([0, 20, 40, 60, 80, 100])
    inc_cumsum  = np.concatenate([[0], np.cumsum(shares)])

    # Gini = 1 - 2 * area under Lorenz = (area between diagonal and curve) / 0.5
    gini = 1 - 2 * np.trapz(inc_cumsum / 100, pop_shares / 100)

    fig = go.Figure()

    # Equality diagonal
    fig.add_trace(go.Scatter(
        x=[0, 100], y=[0, 100],
        mode="lines", name="Perfect equality",
        line=dict(color=GRID, width=1.5, dash="dot"),
        hoverinfo="skip",
    ))

    # Lorenz curve
    fig.add_trace(go.Scatter(
        x=pop_shares, y=inc_cumsum,
        mode="lines+markers",
        name=f"Lorenz curve (Gini = {gini:.3f})",
        line=dict(color=VIOLET, width=2.5),
        marker=dict(size=8),
        fill="tonexty",
        fillcolor="rgba(132,94,238,0.12)",
        hovertemplate="Bottom %{x:.0f}% of pop → %{y:.1f}% of income<extra></extra>",
        text=["", "Q1", "Q2", "Q3", "Q4", "Q5"],
    ))

    fig.add_annotation(
        x=60, y=25, text=f"Gini = {gini:.3f}",
        showarrow=False,
        font=dict(size=14, color=VIOLET),
        bgcolor="rgba(255,255,255,0.8)",
        bordercolor=VIOLET,
        borderwidth=1,
    )

    fig.update_layout(
        title=dict(text=f"Lorenz Curve — US Income Distribution ({year_label})", x=0.5),
        xaxis=dict(title="Cumulative population share (%)", range=[0, 100]),
        yaxis=dict(title="Cumulative income share (%)", range=[0, 100]),
        legend=dict(orientation="h", y=1.08),
        margin=dict(t=60, b=50, l=70, r=40),
        height=460,
    )
    apply_theme(fig)
    return fig


fig = generate()
fig.show()
Made with Plotly