
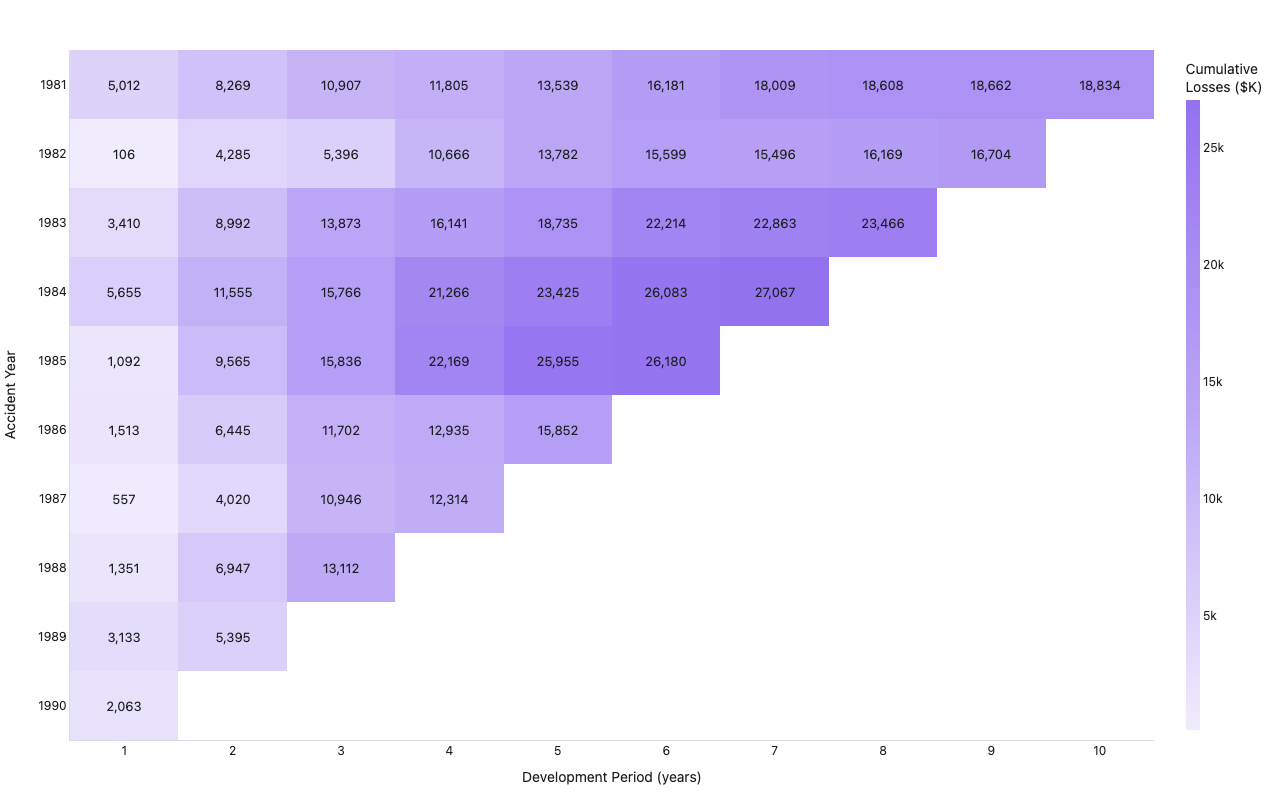
Loss-development triangle
P&C Actuarial — RAA Mack 1994
Example from the compendium of canonical charts
Python Code
"""P&C Actuarial — Loss-development triangle (RAA Mack 1994)."""
from pathlib import Path

# ── Palette + theme (matching the Plotly Studio gallery these charts ship in) ──
VIOLET, TEAL, GREEN, PINK, ORANGE = "#845EEE", "#52B3D0", "#55B685", "#DA5597", "#E9A23B"
PRIMARY, SECONDARY = VIOLET, TEAL
COLORWAY = [VIOLET, TEAL, GREEN, PINK, ORANGE]
BG, TEXT, GRID, MUTED = "#ffffff", "#1c2024", "#d9d9e0", "#60646c"
FONT = "Inter, -apple-system, BlinkMacSystemFont, sans-serif"
COLORSCALE = [[0, "rgba(132, 94, 238, 0.05)"], [1, "rgba(132, 94, 238, 0.9)"]]


def apply_theme(fig):
    """Light gallery theme: white background, Inter font, soft gridlines."""
    fig.update_layout(
        paper_bgcolor=BG, plot_bgcolor=BG, colorway=COLORWAY,
        font=dict(family=FONT, color=TEXT, size=12),
        legend=dict(font=dict(color=TEXT)),
        hoverlabel=dict(bgcolor="#f0f0f3", font=dict(color=TEXT, family=FONT), bordercolor=GRID),
    )
    fig.update_xaxes(gridcolor=GRID, linecolor=GRID, zerolinecolor=GRID)
    fig.update_yaxes(gridcolor=GRID, linecolor=GRID, zerolinecolor=GRID)


def fetch_csv(url, **kwargs):
    import io
    import pandas as pd
    import requests
    r = requests.get(url, timeout=60)
    r.raise_for_status()
    return pd.read_csv(io.StringIO(r.text), **kwargs)


def fetch_json(url):
    import requests
    r = requests.get(url, timeout=60)
    r.raise_for_status()
    return r.json()

import numpy as np
import plotly.graph_objects as go


ACCIDENT_YEARS = list(range(1981, 1991))
RAW = [
    [5012,  8269, 10907, 11805, 13539, 16181, 18009, 18608, 18662, 18834],
    [ 106,  4285,  5396, 10666, 13782, 15599, 15496, 16169, 16704,  None],
    [3410,  8992, 13873, 16141, 18735, 22214, 22863, 23466,  None,  None],
    [5655, 11555, 15766, 21266, 23425, 26083, 27067,  None,  None,  None],
    [1092,  9565, 15836, 22169, 25955, 26180,  None,  None,  None,  None],
    [1513,  6445, 11702, 12935, 15852,  None,  None,  None,  None,  None],
    [ 557,  4020, 10946, 12314,  None,  None,  None,  None,  None,  None],
    [1351,  6947, 13112,  None,  None,  None,  None,  None,  None,  None],
    [3133,  5395,  None,  None,  None,  None,  None,  None,  None,  None],
    [2063,  None,  None,  None,  None,  None,  None,  None,  None,  None],
]
DEV_PERIODS = [str(i) for i in range(1, 11)]


def generate():
    # For heatmap, replace None with NaN for correct blank rendering
    z_num = [[v if v is not None else float("nan") for v in row] for row in RAW]

    # Build text annotations
    text = []
    for row in RAW:
        text_row = []
        for v in row:
            text_row.append(f"{v:,}" if v is not None else "")
        text.append(text_row)

    fig = go.Figure(go.Heatmap(
        z=z_num,
        x=DEV_PERIODS,
        y=[str(y) for y in ACCIDENT_YEARS],
        text=text,
        texttemplate="%{text}",
        textfont=dict(size=13, color="#1c2024"),
        colorscale=[
            [0.0, "rgba(132, 94, 238, 0.12)"],
            [0.5, "rgba(132, 94, 238, 0.55)"],
            [1.0, "rgba(132, 94, 238, 0.88)"],
        ],
        colorbar=dict(title="Cumulative<br>Losses ($K)", thickness=14),
        hovertemplate="AY %{y}, Dev %{x}: %{text}<extra></extra>",
    ))

    fig.update_layout(
        xaxis=dict(title="Development Period (years)", showgrid=False),
        yaxis=dict(title="Accident Year", autorange="reversed", showgrid=False),
        margin=dict(t=50, b=60, l=70, r=80),
    )
    apply_theme(fig)
    return fig


fig = generate()
fig.show()
Made with Plotly