
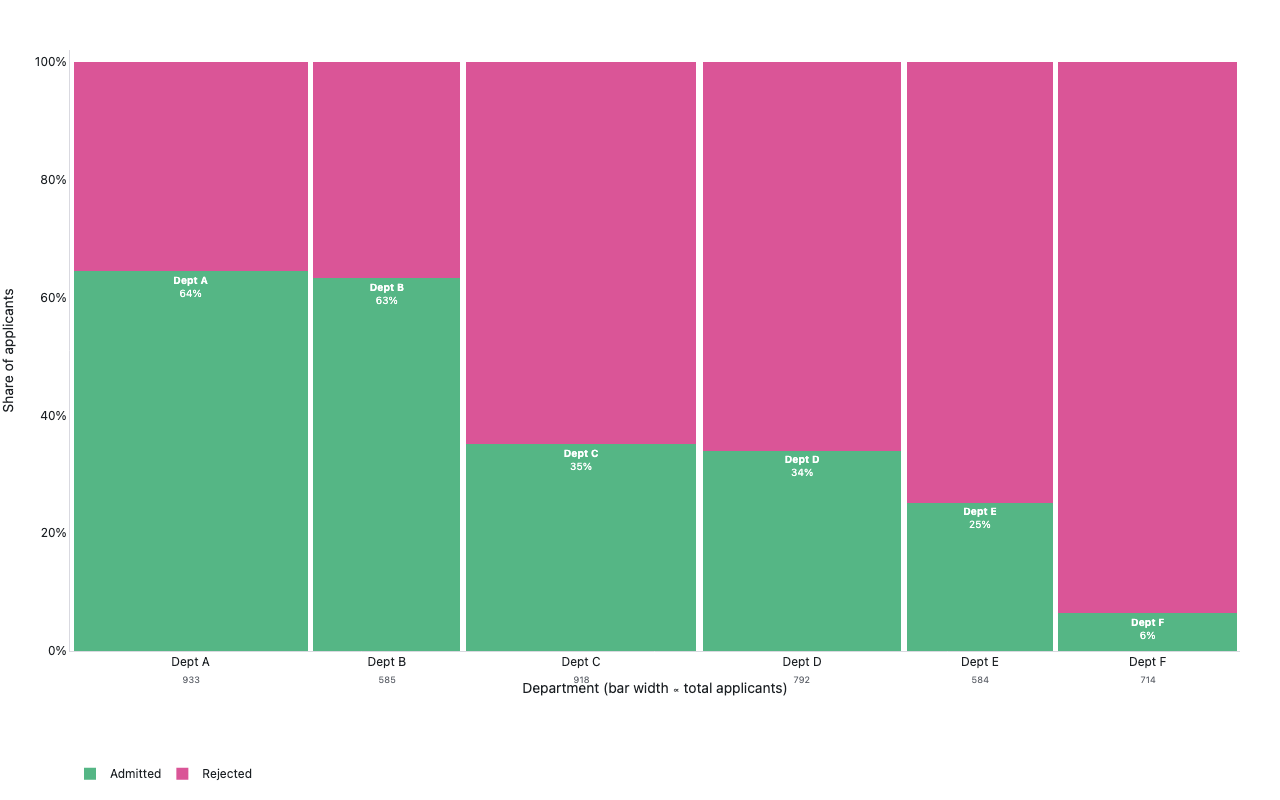
Marimekko chart
Business — UCB Admissions by department
Example from the compendium of canonical charts
Python Code
"""Business — Marimekko chart (UCB Admissions by department)."""
from pathlib import Path

# ── Palette + theme (matching the Plotly Studio gallery these charts ship in) ──
VIOLET, TEAL, GREEN, PINK, ORANGE = "#845EEE", "#52B3D0", "#55B685", "#DA5597", "#E9A23B"
PRIMARY, SECONDARY = VIOLET, TEAL
COLORWAY = [VIOLET, TEAL, GREEN, PINK, ORANGE]
BG, TEXT, GRID, MUTED = "#ffffff", "#1c2024", "#d9d9e0", "#60646c"
FONT = "Inter, -apple-system, BlinkMacSystemFont, sans-serif"
COLORSCALE = [[0, "rgba(132, 94, 238, 0.05)"], [1, "rgba(132, 94, 238, 0.9)"]]


def apply_theme(fig):
    """Light gallery theme: white background, Inter font, soft gridlines."""
    fig.update_layout(
        paper_bgcolor=BG, plot_bgcolor=BG, colorway=COLORWAY,
        font=dict(family=FONT, color=TEXT, size=12),
        legend=dict(font=dict(color=TEXT)),
        hoverlabel=dict(bgcolor="#f0f0f3", font=dict(color=TEXT, family=FONT), bordercolor=GRID),
    )
    fig.update_xaxes(gridcolor=GRID, linecolor=GRID, zerolinecolor=GRID)
    fig.update_yaxes(gridcolor=GRID, linecolor=GRID, zerolinecolor=GRID)


def fetch_csv(url, **kwargs):
    import io
    import pandas as pd
    import requests
    r = requests.get(url, timeout=60)
    r.raise_for_status()
    return pd.read_csv(io.StringIO(r.text), **kwargs)


def fetch_json(url):
    import requests
    r = requests.get(url, timeout=60)
    r.raise_for_status()
    return r.json()

import pandas as pd
import plotly.graph_objects as go

URL = "https://vincentarelbundock.github.io/Rdatasets/csv/datasets/UCBAdmissions.csv"


def generate():
    print("fetching UCBAdmissions from Rdatasets …")
    df = fetch_csv(URL)
    print("columns:", df.columns.tolist())
    print(df.head(6))

    df.columns = [c.strip().lower() for c in df.columns]
    # Expected cols: admit, gender, dept, freq

    # Aggregate over gender to get dept totals
    dept_total = df.groupby("dept")["freq"].sum().reset_index()
    dept_total.columns = ["dept", "total"]
    dept_total = dept_total.sort_values("dept")

    admitted = df[df["admit"].str.lower() == "admitted"].groupby("dept")["freq"].sum()
    rejected = df[df["admit"].str.lower() == "rejected"].groupby("dept")["freq"].sum()

    dept_total = dept_total.set_index("dept")
    dept_total["admitted"] = admitted
    dept_total["rejected"] = rejected
    dept_total["admit_pct"] = dept_total["admitted"] / dept_total["total"]
    dept_total["reject_pct"] = dept_total["rejected"] / dept_total["total"]
    dept_total = dept_total.reset_index()

    grand_total = dept_total["total"].sum()
    n_dept = len(dept_total)

    # Compute proportional widths (sum to 1) and bar centers
    dept_total["width"] = dept_total["total"] / grand_total
    dept_total["center"] = dept_total["width"].cumsum() - dept_total["width"] / 2

    fig = go.Figure()

    for _, row in dept_total.iterrows():
        dept = row["dept"]
        cx   = row["center"]
        w    = row["width"]

        # Admitted bar (bottom portion, from 0 to admit_pct)
        fig.add_trace(go.Bar(
            x=[cx],
            y=[row["admit_pct"]],
            width=[w * 0.97],  # small gap between departments
            marker_color=GREEN,
            marker_line_width=0,
            name="Admitted" if dept == dept_total["dept"].iloc[0] else None,
            showlegend=(dept == dept_total["dept"].iloc[0]),
            legendgroup="Admitted",
            hovertemplate=f"<b>Dept {dept}</b><br>Admitted: {row['admit_pct']:.1%}<br>n={row['admitted']:.0f}<extra></extra>",
            text=[f"<b>Dept {dept}</b><br>{row['admit_pct']:.0%}"],
            textposition="inside",
            textfont=dict(size=10, color="white"),
            base=0,
        ))

        # Rejected bar (top portion, from admit_pct to 1)
        fig.add_trace(go.Bar(
            x=[cx],
            y=[row["reject_pct"]],
            width=[w * 0.97],
            marker_color=PINK,
            marker_line_width=0,
            name="Rejected" if dept == dept_total["dept"].iloc[0] else None,
            showlegend=(dept == dept_total["dept"].iloc[0]),
            legendgroup="Rejected",
            hovertemplate=f"<b>Dept {dept}</b><br>Rejected: {row['reject_pct']:.1%}<br>n={row['rejected']:.0f}<extra></extra>",
            base=row["admit_pct"],
        ))

    # Column-width legend via annotations
    for _, row in dept_total.iterrows():
        fig.add_annotation(
            x=row["center"], y=-0.06,
            xref="x", yref="paper",
            text=f"{row['total']:.0f}",
            showarrow=False,
            font=dict(size=9, color="#60646c"),
        )

    fig.update_layout(
        barmode="stack",
        xaxis=dict(
            title="Department (bar width ∝ total applicants)",
            tickvals=dept_total["center"].tolist(),
            ticktext=[f"Dept {d}" for d in dept_total["dept"]],
            showgrid=False,
            zeroline=False,
            range=[0, 1],
        ),
        yaxis=dict(
            title="Share of applicants",
            tickformat=".0%",
            range=[0, 1.02],
            showgrid=False,
            zeroline=False,
        ),
        legend=dict(orientation="h", y=-0.18),
        margin=dict(t=50, b=80, l=55, r=40),
    )
    apply_theme(fig)
    return fig


fig = generate()
fig.show()
Made with Plotly