
Market map (treemap) of S&P 500 top 50 by market cap
Finance Terminal
Example from the compendium of canonical charts
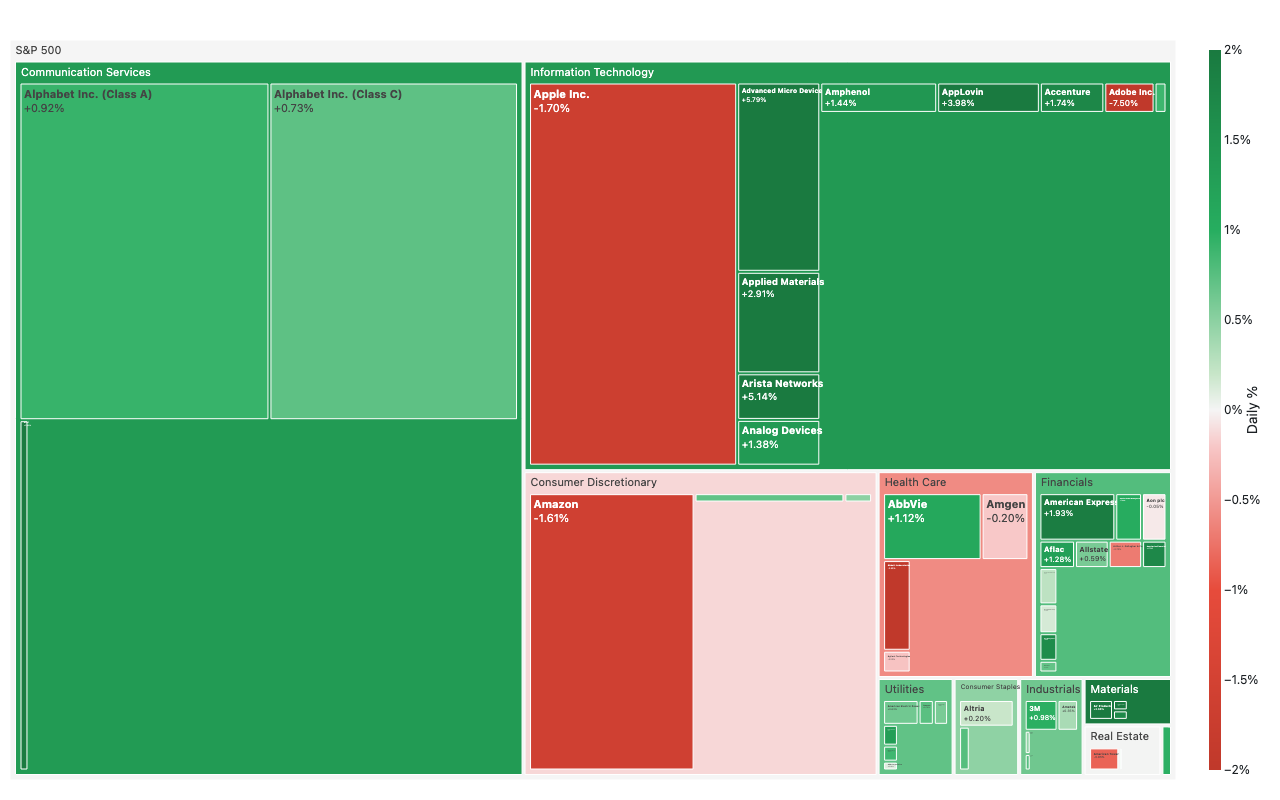
Python Code
"""Finance Terminal — Market map (treemap) of S&P 500 top 50 by market cap."""
from pathlib import Path

# ── Palette + theme (matching the Plotly Studio gallery these charts ship in) ──
VIOLET, TEAL, GREEN, PINK, ORANGE = "#845EEE", "#52B3D0", "#55B685", "#DA5597", "#E9A23B"
PRIMARY, SECONDARY = VIOLET, TEAL
COLORWAY = [VIOLET, TEAL, GREEN, PINK, ORANGE]
BG, TEXT, GRID, MUTED = "#ffffff", "#1c2024", "#d9d9e0", "#60646c"
FONT = "Inter, -apple-system, BlinkMacSystemFont, sans-serif"
COLORSCALE = [[0, "rgba(132, 94, 238, 0.05)"], [1, "rgba(132, 94, 238, 0.9)"]]


def apply_theme(fig):
    """Light gallery theme: white background, Inter font, soft gridlines."""
    fig.update_layout(
        paper_bgcolor=BG, plot_bgcolor=BG, colorway=COLORWAY,
        font=dict(family=FONT, color=TEXT, size=12),
        legend=dict(font=dict(color=TEXT)),
        hoverlabel=dict(bgcolor="#f0f0f3", font=dict(color=TEXT, family=FONT), bordercolor=GRID),
    )
    fig.update_xaxes(gridcolor=GRID, linecolor=GRID, zerolinecolor=GRID)
    fig.update_yaxes(gridcolor=GRID, linecolor=GRID, zerolinecolor=GRID)


def fetch_csv(url, **kwargs):
    import io
    import pandas as pd
    import requests
    r = requests.get(url, timeout=60)
    r.raise_for_status()
    return pd.read_csv(io.StringIO(r.text), **kwargs)


def fetch_json(url):
    import requests
    r = requests.get(url, timeout=60)
    r.raise_for_status()
    return r.json()

import numpy as np
import pandas as pd
import plotly.graph_objects as go
import warnings
warnings.filterwarnings("ignore")


SP500_URL = "https://raw.githubusercontent.com/datasets/s-and-p-500-companies/main/data/constituents.csv"

def get_market_data():
    """Fetch top-50 S&P 500 constituents and their market cap + daily change."""
    try:
        import yfinance as yf
        sp500 = fetch_csv(SP500_URL)
        # Column names: Symbol, Security, GICS Sector
        name_col = next((c for c in sp500.columns if "Security" in c or c == "Name"), sp500.columns[1])
        sector_col = next((c for c in sp500.columns if "Sector" in c), sp500.columns[2])
        # Take first 50 symbols for rate-limit friendliness
        symbols = sp500["Symbol"].head(50).tolist()
        names = dict(zip(sp500["Symbol"], sp500[name_col]))
        sectors = dict(zip(sp500["Symbol"], sp500[sector_col]))

        # Batch download 2 days of close prices
        data = yf.download(symbols, period="2d", auto_adjust=True, progress=False)["Close"]
        # Ensure DataFrame even if one symbol
        if isinstance(data, pd.Series):
            data = data.to_frame()
        pct_change = data.pct_change().iloc[-1].dropna()

        # Get market caps via fast_info
        market_caps = {}
        for sym in pct_change.index:
            try:
                mc = yf.Ticker(sym).fast_info.market_cap
                if mc and mc > 0:
                    market_caps[sym] = mc
            except Exception:
                pass

        if len(market_caps) < 5:
            raise ValueError("Too few market caps fetched")

        rows = []
        for sym, mc in market_caps.items():
            if sym in pct_change.index:
                rows.append({
                    "symbol": sym,
                    "name": names.get(sym, sym),
                    "sector": sectors.get(sym, "Unknown"),
                    "market_cap": mc,
                    "pct_change": pct_change[sym] * 100,
                })
        return pd.DataFrame(rows)

    except Exception as e:
        print(f"  yfinance failed ({e}), using synthetic data")
        return None


def make_synthetic():
    """Synthetic S&P 500 market map data."""
    rng = np.random.default_rng(42)
    sectors_data = {
        "Technology": [("AAPL", "Apple"), ("MSFT", "Microsoft"), ("NVDA", "NVIDIA"),
                       ("GOOGL", "Alphabet"), ("META", "Meta"), ("AVGO", "Broadcom"),
                       ("AMD", "AMD"), ("ORCL", "Oracle")],
        "Healthcare": [("LLY", "Eli Lilly"), ("UNH", "UnitedHealth"), ("JNJ", "Johnson & Johnson"),
                       ("ABBV", "AbbVie"), ("MRK", "Merck")],
        "Financials": [("BRK-B", "Berkshire"), ("JPM", "JPMorgan"), ("V", "Visa"),
                       ("MA", "Mastercard"), ("BAC", "Bank of America")],
        "Consumer Disc.": [("AMZN", "Amazon"), ("TSLA", "Tesla"), ("HD", "Home Depot"),
                           ("MCD", "McDonald's"), ("NKE", "Nike")],
        "Industrials": [("GE", "GE"), ("CAT", "Caterpillar"), ("UPS", "UPS"),
                        ("HON", "Honeywell"), ("BA", "Boeing")],
        "Energy": [("XOM", "ExxonMobil"), ("CVX", "Chevron"), ("COP", "ConocoPhillips"),
                   ("SLB", "Schlumberger")],
        "Communication": [("NFLX", "Netflix"), ("DIS", "Disney"), ("T", "AT&T"),
                          ("VZ", "Verizon")],
        "Utilities": [("NEE", "NextEra"), ("DUK", "Duke Energy"), ("SO", "Southern Co")],
        "Materials": [("LIN", "Linde"), ("APD", "Air Products"), ("SHW", "Sherwin")],
        "Real Estate": [("PLD", "Prologis"), ("AMT", "American Tower"), ("EQIX", "Equinix")],
    }
    rows = []
    base_caps = {"Technology": 2e12, "Healthcare": 5e11, "Financials": 6e11,
                 "Consumer Disc.": 8e11, "Industrials": 3e11, "Energy": 4e11,
                 "Communication": 3e11, "Utilities": 1e11, "Materials": 1e11, "Real Estate": 1.5e11}
    for sector, stocks in sectors_data.items():
        n = len(stocks)
        caps = rng.dirichlet(np.ones(n)) * base_caps.get(sector, 2e11)
        changes = rng.normal(0.3, 1.5, n)
        for (sym, name), cap, chg in zip(stocks, caps, changes):
            rows.append({"symbol": sym, "name": name, "sector": sector,
                         "market_cap": cap, "pct_change": chg})
    return pd.DataFrame(rows)


def build_fig(df):
    # Build treemap ids/labels/parents
    # Sector nodes
    sectors = df["sector"].unique().tolist()
    sector_caps = df.groupby("sector")["market_cap"].sum()

    ids = ["S&P 500"] + sectors + df["symbol"].tolist()
    labels = ["S&P 500"] + sectors + df["name"].tolist()
    parents = [""] + ["S&P 500"] * len(sectors) + df["sector"].tolist()
    values = [0] + [sector_caps[s] for s in sectors] + df["market_cap"].tolist()

    pct = df["pct_change"].tolist()
    # Sectors get avg pct_change, root gets 0
    sector_avg = df.groupby("sector")["pct_change"].mean()
    colors = [0.0] + [sector_avg[s] for s in sectors] + pct

    # Clamp colors to [-2, 2]
    colors = [max(-2.0, min(2.0, c)) for c in colors]

    colorscale = [
        [0.0,  "#c0392b"],
        [0.25, "#e74c3c"],
        [0.45, "#f8c8c8"],
        [0.5,  "#f5f5f5"],
        [0.55, "#c8e6c9"],
        [0.75, "#27ae60"],
        [1.0,  "#1a7a40"],
    ]

    fig = go.Figure(go.Treemap(
        ids=ids,
        labels=labels,
        parents=parents,
        values=values,
        marker=dict(
            colors=colors,
            coloraxis="coloraxis",
        ),
        customdata=[""] * (1 + len(sectors)) + [f"{p:+.2f}%" for p in pct],
        texttemplate="<b>%{label}</b><br>%{customdata}",
        hovertemplate="<b>%{label}</b><br>Market Cap: $%{value:,.0f}<br>Change: %{customdata}<extra></extra>",
        textfont=dict(size=11),
        tiling=dict(packing="squarify"),
    ))

    fig.update_layout(
        coloraxis=dict(
            colorscale=colorscale,
            cmin=-2,
            cmid=0,
            cmax=2,
            colorbar=dict(
                title=dict(text="Daily %", side="right"),
                tickformat="+.1f",
                ticksuffix="%",
                thickness=12,
            ),
        ),
        margin=dict(t=40, b=20, l=10, r=10),
    )
    return fig


def generate():
    df = get_market_data()
    if df is None or len(df) < 5:
        df = make_synthetic()
        print("  using synthetic market data")
    else:
        # Reject if pct_change is nearly all zero (flat market data / weekend fetch)
        if df["pct_change"].abs().mean() < 0.05:
            print("  pct_change near-zero (flat data), using synthetic")
            df = make_synthetic()
        else:
            print(f"  fetched {len(df)} stocks from yfinance")

    fig = build_fig(df)
    apply_theme(fig)
    return fig


fig = generate()
fig.show()
Made with Plotly