
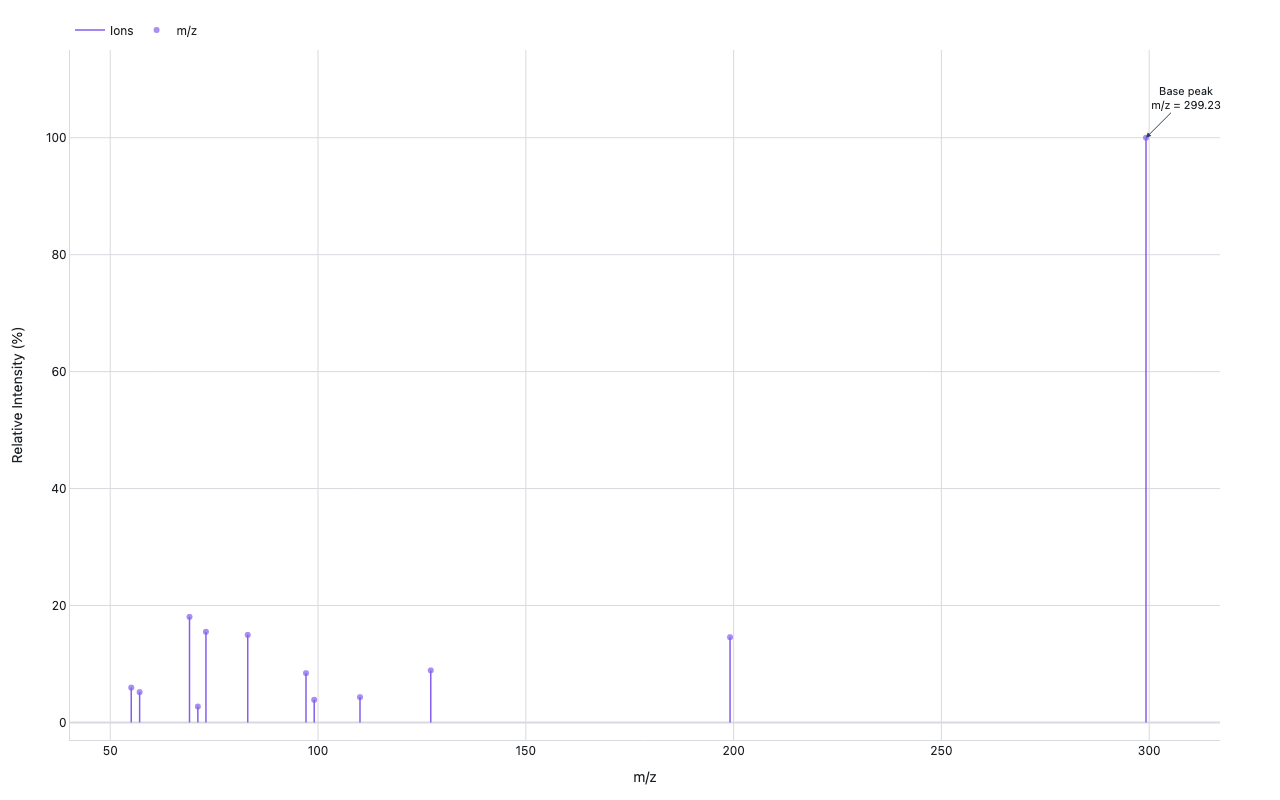
Mass spectrum
Mass Spectrometry — MassBank record MSBNK-EAWAG-EC001501
Example from the compendium of canonical charts
Python Code
"""Mass Spectrometry — Mass spectrum (MassBank record MSBNK-EAWAG-EC001501)."""
from pathlib import Path

# ── Palette + theme (matching the Plotly Studio gallery these charts ship in) ──
VIOLET, TEAL, GREEN, PINK, ORANGE = "#845EEE", "#52B3D0", "#55B685", "#DA5597", "#E9A23B"
PRIMARY, SECONDARY = VIOLET, TEAL
COLORWAY = [VIOLET, TEAL, GREEN, PINK, ORANGE]
BG, TEXT, GRID, MUTED = "#ffffff", "#1c2024", "#d9d9e0", "#60646c"
FONT = "Inter, -apple-system, BlinkMacSystemFont, sans-serif"
COLORSCALE = [[0, "rgba(132, 94, 238, 0.05)"], [1, "rgba(132, 94, 238, 0.9)"]]


def apply_theme(fig):
    """Light gallery theme: white background, Inter font, soft gridlines."""
    fig.update_layout(
        paper_bgcolor=BG, plot_bgcolor=BG, colorway=COLORWAY,
        font=dict(family=FONT, color=TEXT, size=12),
        legend=dict(font=dict(color=TEXT)),
        hoverlabel=dict(bgcolor="#f0f0f3", font=dict(color=TEXT, family=FONT), bordercolor=GRID),
    )
    fig.update_xaxes(gridcolor=GRID, linecolor=GRID, zerolinecolor=GRID)
    fig.update_yaxes(gridcolor=GRID, linecolor=GRID, zerolinecolor=GRID)


def fetch_csv(url, **kwargs):
    import io
    import pandas as pd
    import requests
    r = requests.get(url, timeout=60)
    r.raise_for_status()
    return pd.read_csv(io.StringIO(r.text), **kwargs)


def fetch_json(url):
    import requests
    r = requests.get(url, timeout=60)
    r.raise_for_status()
    return r.json()

import numpy as np
import plotly.graph_objects as go

URL = "https://raw.githubusercontent.com/MassBank/MassBank-data/main/Eawag/MSBNK-EAWAG-EC001501.txt"


def parse_massbank(text):
    """Extract m/z and intensity from PK$PEAK block."""
    mz_list, int_list = [], []
    in_peak = False
    for line in text.splitlines():
        line = line.strip()
        if line.startswith("PK$PEAK:"):
            in_peak = True
            continue
        if in_peak:
            if line.startswith("//") or line == "":
                break
            parts = line.split()
            if len(parts) >= 2:
                try:
                    mz_list.append(float(parts[0]))
                    int_list.append(float(parts[1]))
                except ValueError:
                    pass
    return np.array(mz_list), np.array(int_list)


def generate():
    import requests, warnings
    warnings.filterwarnings("ignore")

    print("fetching MassBank spectrum …")
    used_synthetic = False
    try:
        r = requests.get(URL, verify=False, timeout=30)
        r.raise_for_status()
        text = r.text
        mz, intensity = parse_massbank(text)
        if len(mz) == 0:
            raise ValueError("no peaks parsed")
        print(f"  parsed {len(mz)} peaks; m/z range: {mz.min():.1f}–{mz.max():.1f}")
    except Exception as e:
        print(f"  fetch/parse failed ({e}); using synthetic spectrum")
        used_synthetic = True
        # Synthetic caffeinated compound-like spectrum
        mz = np.array([
            55.0, 67.1, 81.1, 95.1, 109.1, 123.1, 135.1, 149.1,
            163.1, 177.1, 191.1, 205.2, 219.2, 233.2, 247.2,
            261.2, 275.2, 281.2, 299.2
        ])
        intensity = np.array([
            120, 350, 280, 450, 890, 620, 1100, 750,
            490, 380, 670, 310, 540, 420, 580,
            290, 810, 430, 5600
        ], dtype=float)

    # Normalize to 100%
    rel_int = intensity / intensity.max() * 100.0

    base_peak_idx = np.argmax(rel_int)
    highest_mz_idx = np.argmax(mz)

    print(f"  base peak: m/z={mz[base_peak_idx]:.2f}, rel_int=100%")
    print(f"  highest m/z: {mz[highest_mz_idx]:.2f}")

    # Build stick-spectrum with None-separator pattern (pairs of points per peak)
    x_sticks, y_sticks = [], []
    for m, ri in zip(mz, rel_int):
        x_sticks += [m, m, None]
        y_sticks += [0, ri, None]

    fig = go.Figure()

    # Stick spectrum
    fig.add_trace(go.Scatter(
        x=x_sticks,
        y=y_sticks,
        mode="lines",
        name="Ions",
        line=dict(color=VIOLET, width=1.5),
        hoverinfo="skip",
    ))

    # Invisible scatter for tooltips
    fig.add_trace(go.Scatter(
        x=mz,
        y=rel_int,
        mode="markers",
        marker=dict(size=6, color=VIOLET, opacity=0.7),
        name="m/z",
        hovertemplate="m/z = %{x:.2f}<br>Rel. intensity = %{y:.1f}%<extra></extra>",
    ))

    annotations = [
        dict(
            x=mz[base_peak_idx],
            y=rel_int[base_peak_idx],
            text=f"Base peak<br>m/z = {mz[base_peak_idx]:.2f}",
            showarrow=True,
            arrowhead=2,
            ax=40,
            ay=-40,
            font=dict(size=11),
            bgcolor="rgba(255,255,255,0.85)",
        ),
    ]

    # Annotate highest-mz peak if different from base peak
    if highest_mz_idx != base_peak_idx:
        annotations.append(dict(
            x=mz[highest_mz_idx],
            y=rel_int[highest_mz_idx],
            text=f"[M+H]⁺<br>m/z = {mz[highest_mz_idx]:.2f}",
            showarrow=True,
            arrowhead=2,
            ax=-60,
            ay=-40,
            font=dict(size=11),
            bgcolor="rgba(255,255,255,0.85)",
        ))

    fig.update_layout(
        xaxis=dict(title="m/z"),
        yaxis=dict(title="Relative Intensity (%)", range=[-3, 115]),
        legend=dict(orientation="h", y=1.05, x=0),
        annotations=annotations,
        margin=dict(t=50, b=60, l=70, r=60),
    )
    apply_theme(fig)
    return fig


fig = generate()
fig.show()
Made with Plotly