
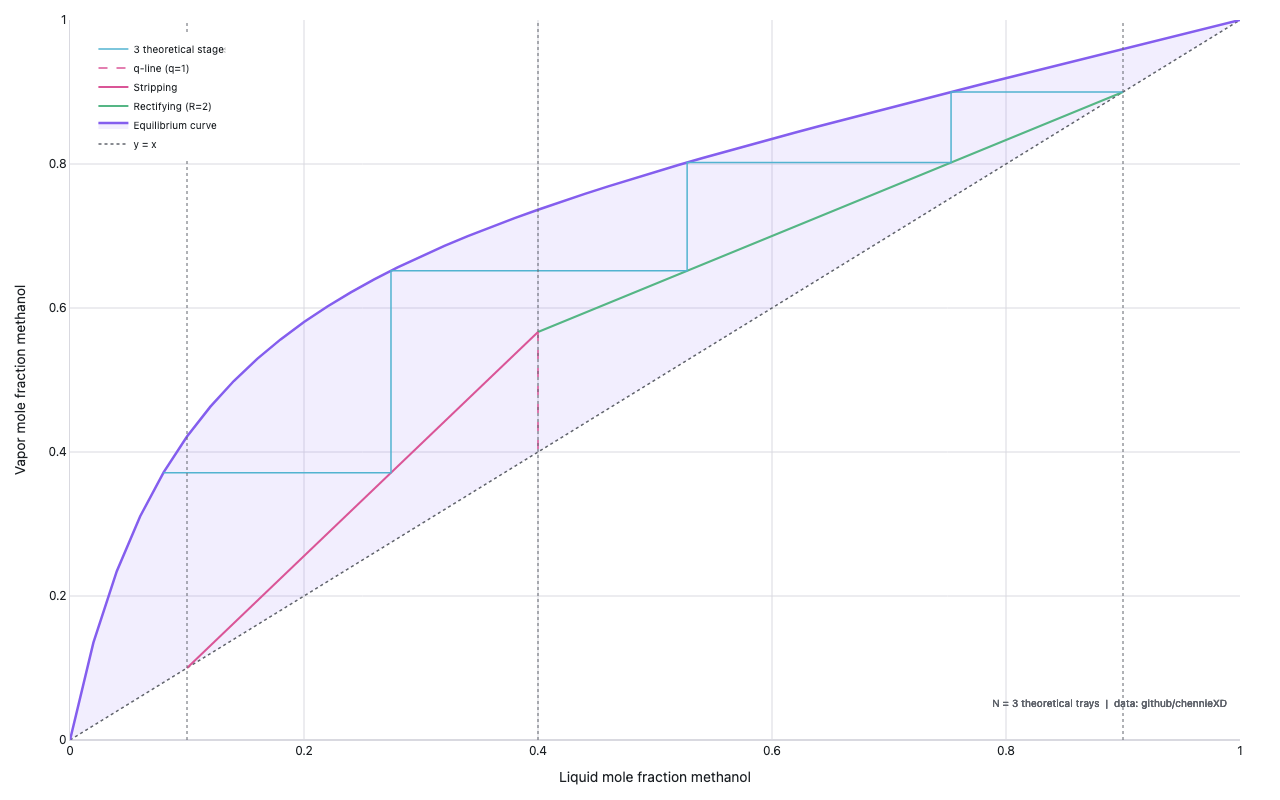
McCabe-Thiele diagram
Chemical Engineering — methanol-water system
Example from the compendium of canonical charts
Python Code
"""Chemical Engineering — McCabe-Thiele diagram (methanol-water system)."""
from pathlib import Path

# ── Palette + theme (matching the Plotly Studio gallery these charts ship in) ──
VIOLET, TEAL, GREEN, PINK, ORANGE = "#845EEE", "#52B3D0", "#55B685", "#DA5597", "#E9A23B"
PRIMARY, SECONDARY = VIOLET, TEAL
COLORWAY = [VIOLET, TEAL, GREEN, PINK, ORANGE]
BG, TEXT, GRID, MUTED = "#ffffff", "#1c2024", "#d9d9e0", "#60646c"
FONT = "Inter, -apple-system, BlinkMacSystemFont, sans-serif"
COLORSCALE = [[0, "rgba(132, 94, 238, 0.05)"], [1, "rgba(132, 94, 238, 0.9)"]]


def apply_theme(fig):
    """Light gallery theme: white background, Inter font, soft gridlines."""
    fig.update_layout(
        paper_bgcolor=BG, plot_bgcolor=BG, colorway=COLORWAY,
        font=dict(family=FONT, color=TEXT, size=12),
        legend=dict(font=dict(color=TEXT)),
        hoverlabel=dict(bgcolor="#f0f0f3", font=dict(color=TEXT, family=FONT), bordercolor=GRID),
    )
    fig.update_xaxes(gridcolor=GRID, linecolor=GRID, zerolinecolor=GRID)
    fig.update_yaxes(gridcolor=GRID, linecolor=GRID, zerolinecolor=GRID)


def fetch_csv(url, **kwargs):
    import io
    import pandas as pd
    import requests
    r = requests.get(url, timeout=60)
    r.raise_for_status()
    return pd.read_csv(io.StringIO(r.text), **kwargs)


def fetch_json(url):
    import requests
    r = requests.get(url, timeout=60)
    r.raise_for_status()
    return r.json()

import numpy as np
import plotly.graph_objects as go


URL = "https://raw.githubusercontent.com/chennieXD/McCabe-Thiele/main/LiquidVaporEquil.csv"


def load_equilibrium():
    try:
        df = fetch_csv(URL)
        print(f"  columns: {list(df.columns)}")
        # Expect two columns: x (liquid) and y (vapor)
        cols = df.columns.tolist()
        # Identify which column is x (liquid) and which is y (vapor)
        # Column names may say "vapor"/"liquid" or be positional
        x_col, y_col = None, None
        for c in cols:
            cl = c.lower()
            if "liquid" in cl:
                x_col = c
            elif "vapor" in cl or "vapour" in cl:
                y_col = c
        if x_col is None or y_col is None:
            x_col, y_col = cols[0], cols[1]
        print(f"  x (liquid)={x_col}, y (vapor)={y_col}")
        x_eq = df[x_col].values.astype(float)
        y_eq = df[y_col].values.astype(float)
        # Sort by x
        order = np.argsort(x_eq)
        return x_eq[order], y_eq[order]
    except Exception as e:
        print(f"  real data failed ({e}), using synthetic VLE")
        return None, None


def synthetic_vle():
    """Methanol-water VLE via relative volatility α ≈ 4.0."""
    alpha = 4.0
    x = np.linspace(0, 1, 50)
    y = alpha * x / (1 + (alpha - 1) * x)
    return x, y


def intersect_lines(m1, b1, m2, b2):
    """Intersection of y = m1*x + b1 and y = m2*x + b2."""
    if abs(m1 - m2) < 1e-12:
        return None
    xi = (b2 - b1) / (m1 - m2)
    yi = m1 * xi + b1
    return xi, yi


def step_stages(x_eq, y_eq, xD, xB, m_rect, b_rect, m_strip, b_strip):
    """Step off trays between equilibrium curve and operating lines."""
    from scipy.interpolate import interp1d

    # Equilibrium interpolators (both directions)
    y_from_x = interp1d(x_eq, y_eq, bounds_error=False, fill_value=(y_eq[0], y_eq[-1]))
    x_from_y = interp1d(y_eq, x_eq, bounds_error=False, fill_value=(x_eq[0], x_eq[-1]))

    steps_x = [xD]
    steps_y = [xD]
    x_current = float(xD)
    n_stages = 0

    for _ in range(50):  # max 50 stages
        # Horizontal step: go left to equilibrium curve (find x given y=y_current)
        y_current = steps_y[-1]
        x_on_eq = float(x_from_y(y_current))
        steps_x.append(x_on_eq)
        steps_y.append(y_current)

        if x_on_eq <= xB + 1e-6:
            break
        n_stages += 1

        # Vertical step: go down to operating line
        # Determine which operating line (rectifying or stripping)
        x_current = x_on_eq
        if x_current > float(intersect_lines(m_rect, b_rect, m_strip, b_strip)[0]) - 1e-4:
            y_op = m_rect * x_current + b_rect
        else:
            y_op = m_strip * x_current + b_strip

        # Clamp to valid range
        y_op = max(xB, min(xD, y_op))
        steps_x.append(x_current)
        steps_y.append(y_op)

        if x_current <= xB + 1e-6:
            break

    return steps_x, steps_y, n_stages


def generate():
    x_eq, y_eq = load_equilibrium()
    if x_eq is None:
        x_eq, y_eq = synthetic_vle()
        note = "synthetic VLE (α=4)"
    else:
        note = "data: github/chennieXD"

    # Design parameters
    xF = 0.4    # feed composition
    xD = 0.9    # distillate
    xB = 0.1    # bottoms
    R  = 2.0    # reflux ratio (L/D)

    # Rectifying operating line: y = R/(R+1) * x + xD/(R+1)
    m_rect = R / (R + 1)
    b_rect = xD / (R + 1)

    # q-line (q=1 → feed is saturated liquid): vertical line at x = xF
    # Intersection with rectifying line: x = xF → y_int
    y_q_int = m_rect * xF + b_rect

    # Stripping operating line: from (xB, xB) to (xF, y_q_int)
    if abs(xF - xB) > 1e-9:
        m_strip = (y_q_int - xB) / (xF - xB)
        b_strip = xB - m_strip * xB
    else:
        m_strip = m_rect
        b_strip = b_rect

    # Stage-stepping
    steps_x, steps_y, n_stages = step_stages(
        x_eq, y_eq, xD, xB, m_rect, b_rect, m_strip, b_strip
    )
    print(f"  theoretical stages: {n_stages}, {note}")

    fig = go.Figure()

    # 45° diagonal first (so fill "tonexty" on equilibrium curve shades the gap)
    fig.add_trace(go.Scatter(
        x=[0, 1], y=[0, 1],
        mode="lines",
        name="y = x",
        line=dict(color=MUTED, width=1.5, dash="dot"),
    ))

    # Equilibrium curve with shaded fill (matches Lorenz Curve aesthetic)
    fig.add_trace(go.Scatter(
        x=x_eq, y=y_eq,
        mode="lines",
        name="Equilibrium curve",
        line=dict(color=VIOLET, width=2.5),
        fill="tonexty",
        fillcolor="rgba(132,94,238,0.10)",
    ))

    # Rectifying operating line
    x_rect = np.array([xD, xF])
    y_rect = m_rect * x_rect + b_rect
    fig.add_trace(go.Scatter(
        x=x_rect, y=y_rect,
        mode="lines",
        name=f"Rectifying (R={R:.0f})",
        line=dict(color=GREEN, width=2),
    ))

    # Stripping operating line
    x_strip = np.array([xB, xF])
    y_strip = m_strip * x_strip + b_strip
    fig.add_trace(go.Scatter(
        x=x_strip, y=y_strip,
        mode="lines",
        name="Stripping",
        line=dict(color=PINK, width=2),
    ))

    # q-line (vertical at xF for saturated liquid feed)
    fig.add_trace(go.Scatter(
        x=[xF, xF], y=[m_rect * xF + b_rect, xF],
        mode="lines",
        name="q-line (q=1)",
        line=dict(color=PINK, width=1.5, dash="dash"),
    ))

    # Staircase
    fig.add_trace(go.Scatter(
        x=steps_x, y=steps_y,
        mode="lines",
        name=f"{n_stages} theoretical stages",
        line=dict(color=TEAL, width=1.5),
        fill=None,
    ))

    # Key composition markers
    for label, xval in [("x_D", xD), ("x_F", xF), ("x_B", xB)]:
        fig.add_vline(
            x=xval,
            line=dict(color=MUTED, width=1, dash="dot"),
            annotation_text=label,
            annotation_position="top",
            annotation_font_size=10,
        )

    fig.update_layout(
        xaxis=dict(title="Liquid mole fraction methanol", range=[0, 1]),
        yaxis=dict(title="Vapor mole fraction methanol", range=[0, 1]),
        legend=dict(x=0.02, y=0.98, xanchor="left", yanchor="top", font=dict(size=10)),
        margin=dict(t=20, b=60, l=70, r=40),
        annotations=[
            dict(
                text=f"N = {n_stages} theoretical trays  |  {note}",
                x=0.98, y=0.04,
                xref="paper", yref="paper",
                xanchor="right",
                showarrow=False,
                font=dict(size=10, color=MUTED),
            )
        ],
    )

    apply_theme(fig)
    return fig


fig = generate()
fig.show()
Made with Plotly