
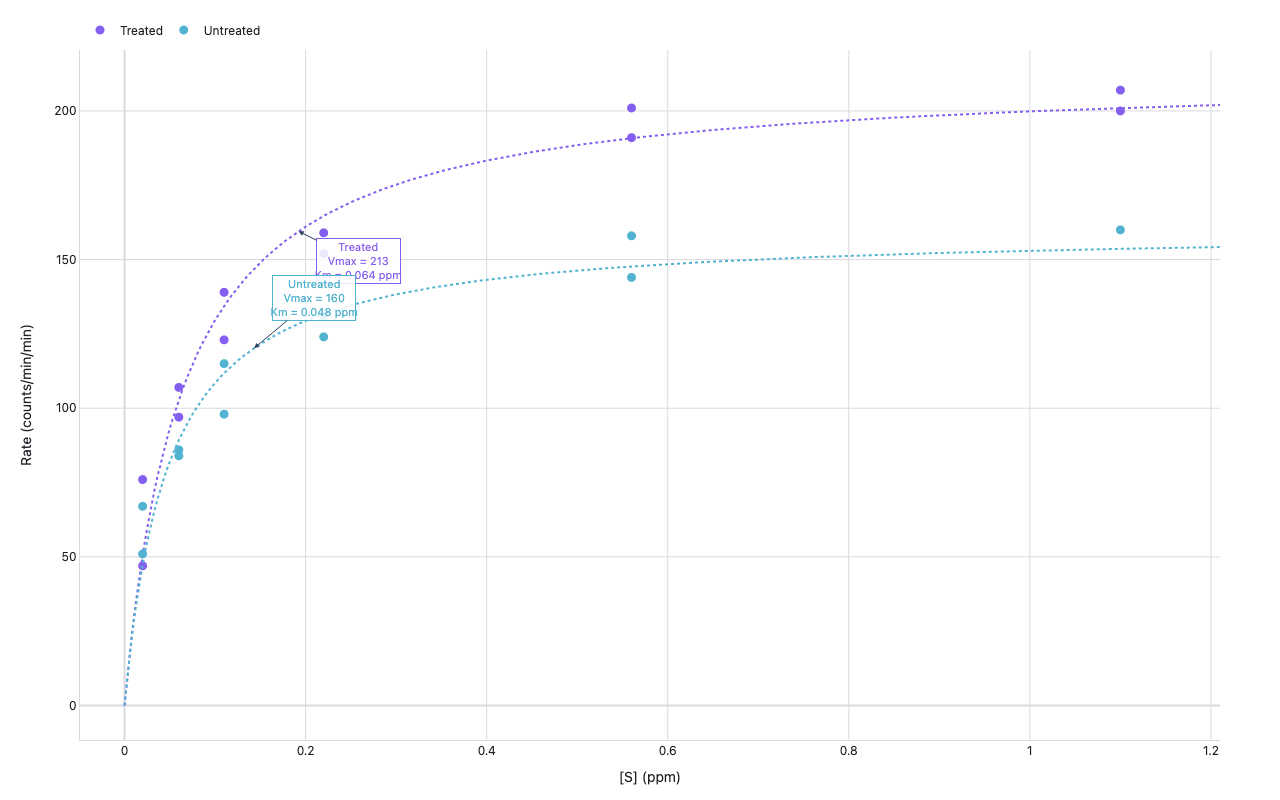
Michaelis-Menten plot
Biochemistry — Puromycin dataset
Example from the compendium of canonical charts
Python Code
"""Biochemistry — Michaelis-Menten plot (Puromycin dataset)."""
from pathlib import Path

# ── Palette + theme (matching the Plotly Studio gallery these charts ship in) ──
VIOLET, TEAL, GREEN, PINK, ORANGE = "#845EEE", "#52B3D0", "#55B685", "#DA5597", "#E9A23B"
PRIMARY, SECONDARY = VIOLET, TEAL
COLORWAY = [VIOLET, TEAL, GREEN, PINK, ORANGE]
BG, TEXT, GRID, MUTED = "#ffffff", "#1c2024", "#d9d9e0", "#60646c"
FONT = "Inter, -apple-system, BlinkMacSystemFont, sans-serif"
COLORSCALE = [[0, "rgba(132, 94, 238, 0.05)"], [1, "rgba(132, 94, 238, 0.9)"]]


def apply_theme(fig):
    """Light gallery theme: white background, Inter font, soft gridlines."""
    fig.update_layout(
        paper_bgcolor=BG, plot_bgcolor=BG, colorway=COLORWAY,
        font=dict(family=FONT, color=TEXT, size=12),
        legend=dict(font=dict(color=TEXT)),
        hoverlabel=dict(bgcolor="#f0f0f3", font=dict(color=TEXT, family=FONT), bordercolor=GRID),
    )
    fig.update_xaxes(gridcolor=GRID, linecolor=GRID, zerolinecolor=GRID)
    fig.update_yaxes(gridcolor=GRID, linecolor=GRID, zerolinecolor=GRID)


def fetch_csv(url, **kwargs):
    import io
    import pandas as pd
    import requests
    r = requests.get(url, timeout=60)
    r.raise_for_status()
    return pd.read_csv(io.StringIO(r.text), **kwargs)


def fetch_json(url):
    import requests
    r = requests.get(url, timeout=60)
    r.raise_for_status()
    return r.json()

import numpy as np
from scipy.optimize import curve_fit
import plotly.graph_objects as go

URL = "https://vincentarelbundock.github.io/Rdatasets/csv/datasets/Puromycin.csv"


def michaelis_menten(S, Vmax, Km):
    return Vmax * S / (Km + S)


def generate():
    print("fetching Puromycin data …")
    used_synthetic = False
    try:
        df = fetch_csv(URL)
        print(f"  cols: {list(df.columns)}, shape: {df.shape}")
        # Column names may vary
        conc_col = [c for c in df.columns if "conc" in c.lower()][0]
        rate_col = [c for c in df.columns if "rate" in c.lower()][0]
        state_col = [c for c in df.columns if "state" in c.lower()][0]
        df = df[[conc_col, rate_col, state_col]].dropna()
        df.columns = ["conc", "rate", "state"]
    except Exception as e:
        print(f"  fetch failed ({e}); using synthetic Puromycin-like data")
        used_synthetic = True
        import pandas as pd
        # Typical Puromycin data (counts/min/min vs ppm)
        conc_t = [0.02, 0.02, 0.06, 0.06, 0.11, 0.11, 0.22, 0.22, 0.56, 0.56, 1.10, 1.10]
        rate_t = [76, 47, 97, 107, 123, 139, 159, 152, 191, 201, 207, 200]
        conc_u = [0.02, 0.02, 0.06, 0.06, 0.11, 0.11, 0.22, 0.22, 0.56, 0.56, 1.10, 1.10]
        rate_u = [67, 51, 84, 86, 98, 115, 131, 124, 144, 158, 160, 183]
        df = pd.DataFrame({
            "conc": conc_t + conc_u,
            "rate": rate_t + rate_u,
            "state": ["treated"] * len(conc_t) + ["untreated"] * len(conc_u),
        })

    states = df["state"].unique().tolist()
    colors = {"treated": VIOLET, "untreated": TEAL}
    # fallback for unexpected state names
    if len(states) == 2:
        color_map = {states[0]: VIOLET, states[1]: TEAL}
    else:
        color_map = {s: c for s, c in zip(states, [VIOLET, TEAL])}

    fig = go.Figure()
    conc_dense = np.linspace(0, df["conc"].max() * 1.1, 300)

    annotations = []

    for state in states:
        sub = df[df["state"] == state]
        S = sub["conc"].values
        v = sub["rate"].values
        color = color_map[state]

        # Fit
        try:
            p0 = [v.max(), np.median(S)]
            popt, _ = curve_fit(michaelis_menten, S, v, p0=p0, maxfev=5000)
            Vmax, Km = popt
            print(f"  {state}: Vmax = {Vmax:.1f}, Km = {Km:.4f}")
        except Exception as e:
            print(f"  fit failed for {state}: {e}; using rough estimate")
            Vmax = v.max() * 1.1
            Km = np.median(S)

        v_fit = michaelis_menten(conc_dense, Vmax, Km)

        # Scatter data points
        fig.add_trace(go.Scatter(
            x=S,
            y=v,
            mode="markers",
            name=state.capitalize(),
            marker=dict(color=color, size=9, symbol="circle"),
            legendgroup=state,
            hovertemplate=f"[S]=%{{x:.3f}} ppm<br>v=%{{y:.0f}} counts/min/min<extra>{state}</extra>",
        ))

        # Fitted hyperbola
        fig.add_trace(go.Scatter(
            x=conc_dense,
            y=v_fit,
            mode="lines",
            name=f"{state.capitalize()} fit",
            line=dict(color=color, width=2, dash="dot"),
            legendgroup=state,
            showlegend=False,
            hoverinfo="skip",
        ))

        # Annotation with Vmax and Km
        ann_x = Km * 3  # somewhere on the rising part of curve
        ann_y = michaelis_menten(ann_x, Vmax, Km)
        offset_y = 30 if state == states[0] else -50
        annotations.append(dict(
            x=ann_x,
            y=ann_y,
            text=f"{state.capitalize()}<br>Vmax = {Vmax:.0f}<br>Km = {Km:.3f} ppm",
            showarrow=True,
            arrowhead=2,
            ax=60,
            ay=offset_y,
            font=dict(size=11, color=color),
            bgcolor="rgba(255,255,255,0.85)",
            bordercolor=color,
            borderwidth=1,
        ))

    fig.update_layout(
        xaxis=dict(title="[S] (ppm)"),
        yaxis=dict(title="Rate (counts/min/min)"),
        legend=dict(orientation="h", y=1.05, x=0),
        annotations=annotations,
        margin=dict(t=50, b=60, l=80, r=60),
    )
    apply_theme(fig)
    return fig


fig = generate()
fig.show()
Made with Plotly