
Network waterfall
HTTP request timeline from Chrome HAR
Example from the compendium of canonical charts
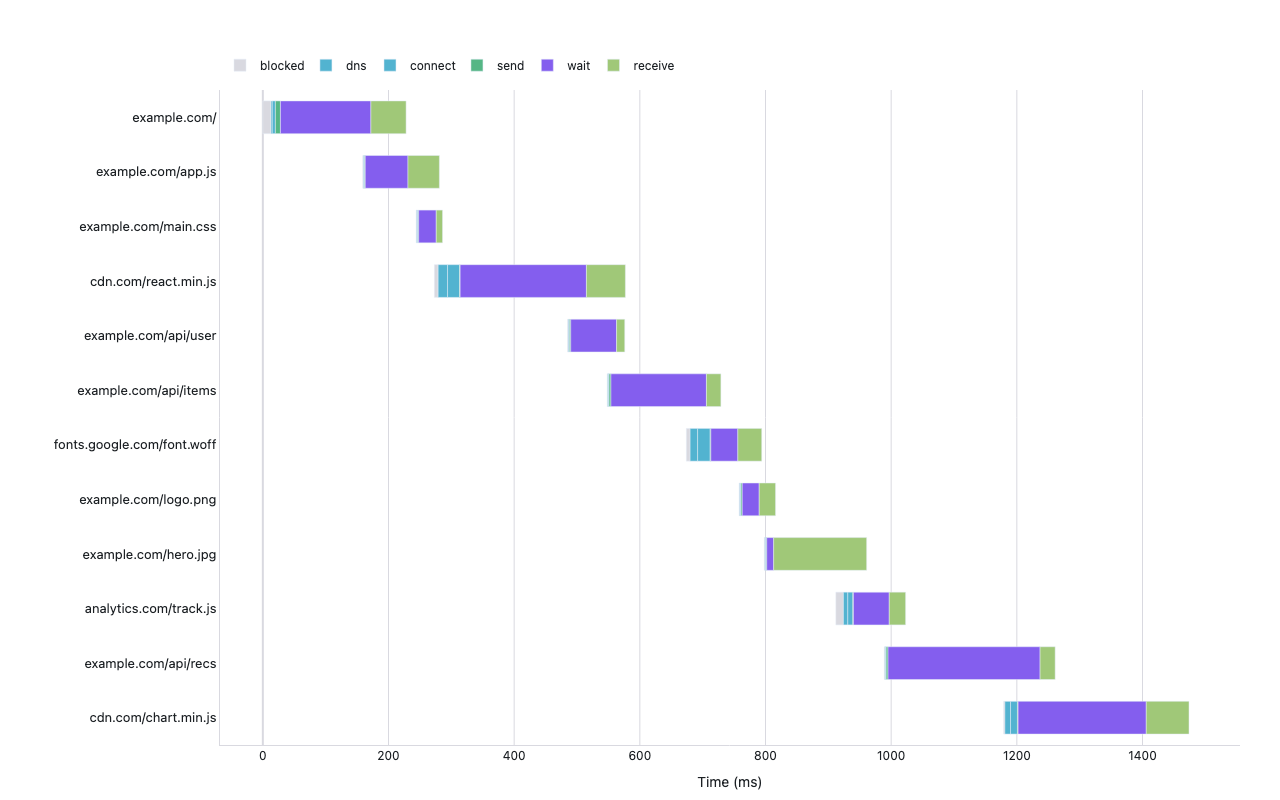
Python Code
"""Network waterfall — HTTP request timeline from Chrome HAR."""
from pathlib import Path

# ── Palette + theme (matching the Plotly Studio gallery these charts ship in) ──
VIOLET, TEAL, GREEN, PINK, ORANGE = "#845EEE", "#52B3D0", "#55B685", "#DA5597", "#E9A23B"
PRIMARY, SECONDARY = VIOLET, TEAL
COLORWAY = [VIOLET, TEAL, GREEN, PINK, ORANGE]
BG, TEXT, GRID, MUTED = "#ffffff", "#1c2024", "#d9d9e0", "#60646c"
FONT = "Inter, -apple-system, BlinkMacSystemFont, sans-serif"
COLORSCALE = [[0, "rgba(132, 94, 238, 0.05)"], [1, "rgba(132, 94, 238, 0.9)"]]


def apply_theme(fig):
    """Light gallery theme: white background, Inter font, soft gridlines."""
    fig.update_layout(
        paper_bgcolor=BG, plot_bgcolor=BG, colorway=COLORWAY,
        font=dict(family=FONT, color=TEXT, size=12),
        legend=dict(font=dict(color=TEXT)),
        hoverlabel=dict(bgcolor="#f0f0f3", font=dict(color=TEXT, family=FONT), bordercolor=GRID),
    )
    fig.update_xaxes(gridcolor=GRID, linecolor=GRID, zerolinecolor=GRID)
    fig.update_yaxes(gridcolor=GRID, linecolor=GRID, zerolinecolor=GRID)


def fetch_csv(url, **kwargs):
    import io
    import pandas as pd
    import requests
    r = requests.get(url, timeout=60)
    r.raise_for_status()
    return pd.read_csv(io.StringIO(r.text), **kwargs)


def fetch_json(url):
    import requests
    r = requests.get(url, timeout=60)
    r.raise_for_status()
    return r.json()

import json
import numpy as np
import plotly.graph_objects as go
import requests, warnings


# Public HAR sample
HAR_URL = "https://raw.githubusercontent.com/nicowillis/HAR-viewer/master/demo-har.json"
HAR_URL2 = "https://raw.githubusercontent.com/janodvarko/harviewer/master/webapp/examples/weather.har"


PHASE_COLORS = {
    "dns":       "#52B3D0",   # teal
    "connect":   "#52B3D0",   # teal
    "ssl":       "#DA5597",   # pink
    "send":      "#55B685",   # green
    "wait":      "#845EEE",   # violet (TTFB — the main cost)
    "receive":   "#A0C878",   # light green
    "blocked":   "#d9d9e0",   # grid gray
    "queued":    "#d9d9e0",
}


def parse_har(har):
    """Extract per-request waterfall segments from HAR data."""
    try:
        entries = har["log"]["entries"]
    except KeyError:
        return []

    rows = []
    t0 = None
    for i, entry in enumerate(entries[:40]):
        try:
            started = entry.get("startedDateTime", "")
            # Parse relative start from startedDateTime + timings
            if t0 is None:
                t0_val = 0.0
                t0 = t0_val
            else:
                t0_val = t0

            url = entry.get("request", {}).get("url", f"request-{i}")
            url_label = url.split("?")[0][-50:] if len(url) > 50 else url
            timings = entry.get("timings", {})
            total_ms = entry.get("time", 0)

            # Accumulate start offset from previous rows
            start = rows[-1]["end"] if rows else 0

            phases = []
            cursor = start
            for phase in ["blocked", "dns", "connect", "ssl", "send", "wait", "receive"]:
                t = timings.get(phase, -1)
                if t is not None and t > 0:
                    phases.append({
                        "phase": phase,
                        "start": cursor,
                        "duration": t,
                        "end": cursor + t,
                    })
                    cursor += t

            rows.append({
                "url": url_label,
                "start": start,
                "end": cursor if cursor > start else start + max(total_ms, 0.1),
                "phases": phases,
            })
        except Exception:
            continue

    return rows


def synthetic_har():
    """Build realistic synthetic HAR waterfall for a typical page load."""
    rng = np.random.default_rng(33)
    entries = [
        ("example.com/",             10,   2,  5,   8,  120, 45),
        ("example.com/app.js",        0,   0,  0,   1,   80, 55),
        ("example.com/main.css",      0,   0,  0,   1,   30, 12),
        ("cdn.com/react.min.js",      5,  15, 20,   1,  200, 85),
        ("example.com/api/user",      0,   0,  0,   2,   95, 18),
        ("example.com/api/items",     0,   0,  0,   2,  145, 32),
        ("fonts.google.com/font.woff", 8,  12, 18,   1,   55, 40),
        ("example.com/logo.png",      0,   0,  0,   1,   25, 30),
        ("example.com/hero.jpg",      0,   0,  0,   1,   15, 180),
        ("analytics.com/track.js",   12,   8, 10,   1,   70, 22),
        ("example.com/api/recs",      0,   0,  0,   2,  220, 28),
        ("cdn.com/chart.min.js",      3,  10, 14,   1,  160, 60),
    ]

    rows = []
    cursor = 0
    for label, blocked, dns, connect, send, wait, receive in entries:
        phases = []
        t = cursor
        for phase, dur in [("blocked", blocked), ("dns", dns),
                            ("connect", connect), ("send", send),
                            ("wait", wait), ("receive", receive)]:
            jitter_lo = -max(1, int(dur*0.3))
            jitter_hi =  max(2, int(dur*0.3)+1)
            dur_j = max(1, dur + int(rng.integers(jitter_lo, jitter_hi)))
            if dur_j > 0:
                phases.append({"phase": phase, "start": t, "duration": dur_j, "end": t + dur_j})
                t += dur_j
        rows.append({"url": label, "start": cursor, "end": t, "phases": phases})
        # Next request starts ~90% through current (parallel pipeline)
        overlap = max(0, int((t - cursor) * 0.7))
        cursor = cursor + overlap
    return rows


def generate():
    print("fetching HAR file …")
    warnings.filterwarnings("ignore")
    try:
        requests.packages.urllib3.disable_warnings()
    except Exception:
        pass

    rows = None
    for url in [HAR_URL, HAR_URL2]:
        try:
            r = requests.get(url, verify=False, timeout=20)
            if r.status_code == 200:
                har = r.json()
                rows = parse_har(har)
                if rows:
                    source = url.split("/")[-1]
                    print(f"  parsed {len(rows)} entries from {url}")
                    break
        except Exception as e:
            print(f"  {url} failed: {e}")

    if not rows:
        print("  using synthetic HAR data")
        rows = synthetic_har()
        source = "Synthetic page load"

    # Build gantt-style figure
    fig = go.Figure()

    phase_names = list(PHASE_COLORS.keys())
    legend_added = set()
    y_labels = [r["url"] for r in rows]

    for i, row in enumerate(rows):
        y_pos = len(rows) - 1 - i  # top to bottom
        for seg in row["phases"]:
            ph = seg["phase"]
            color = PHASE_COLORS.get(ph, "#aaaaaa")
            show_legend = ph not in legend_added
            legend_added.add(ph)
            dur = max(seg["duration"], 0.1)   # avoid low >= high with zero-width bars
            fig.add_trace(go.Bar(
                x=[dur],
                y=[row["url"]],
                base=[seg["start"]],
                orientation="h",
                marker=dict(color=color),
                name=ph,
                legendgroup=ph,
                showlegend=show_legend,
                hovertemplate=f"<b>{row['url']}</b><br>{ph}: {seg['duration']:.1f}ms<extra></extra>",
                width=0.6,
            ))

    fig.update_layout(
        title=dict(text=f"Network Waterfall — {source}", x=0.5),
        barmode="overlay",
        xaxis=dict(title="Time (ms)"),
        yaxis=dict(
            title="",
            autorange="reversed",
            tickfont=dict(size=13),
            showgrid=False,
        ),
        legend=dict(orientation="h", y=1.06, x=0, traceorder="normal", font=dict(size=12)),
        margin=dict(t=90, b=40, l=220, r=40),
        height=max(350, len(rows) * 28 + 120),
    )
    apply_theme(fig)
    return fig


fig = generate()
fig.show()
Made with Plotly