
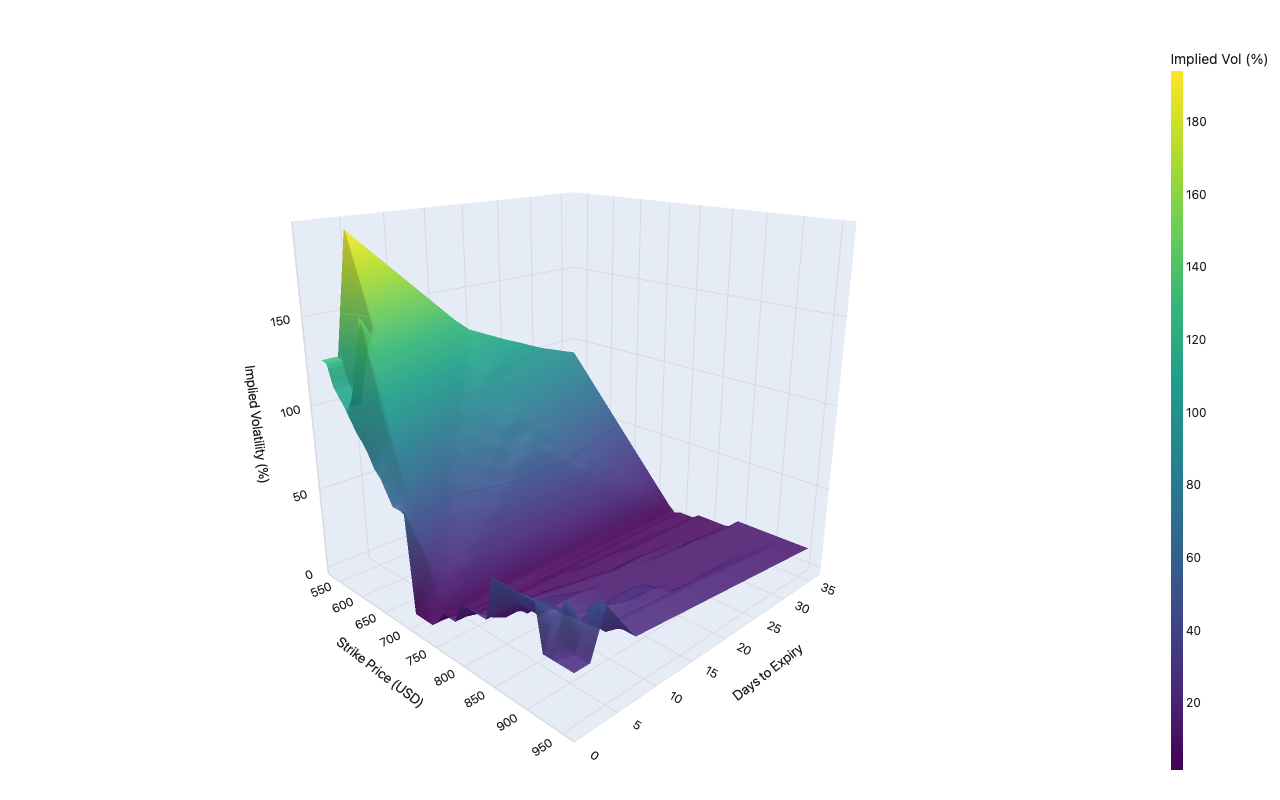
Volatility surface for SPY options across strikes and expiries
Options
Example from the compendium of canonical charts
Python Code
"""Options — Volatility surface for SPY options across strikes and expiries."""
from pathlib import Path

# ── Palette + theme (matching the Plotly Studio gallery these charts ship in) ──
VIOLET, TEAL, GREEN, PINK, ORANGE = "#845EEE", "#52B3D0", "#55B685", "#DA5597", "#E9A23B"
PRIMARY, SECONDARY = VIOLET, TEAL
COLORWAY = [VIOLET, TEAL, GREEN, PINK, ORANGE]
BG, TEXT, GRID, MUTED = "#ffffff", "#1c2024", "#d9d9e0", "#60646c"
FONT = "Inter, -apple-system, BlinkMacSystemFont, sans-serif"
COLORSCALE = [[0, "rgba(132, 94, 238, 0.05)"], [1, "rgba(132, 94, 238, 0.9)"]]


def apply_theme(fig):
    """Light gallery theme: white background, Inter font, soft gridlines."""
    fig.update_layout(
        paper_bgcolor=BG, plot_bgcolor=BG, colorway=COLORWAY,
        font=dict(family=FONT, color=TEXT, size=12),
        legend=dict(font=dict(color=TEXT)),
        hoverlabel=dict(bgcolor="#f0f0f3", font=dict(color=TEXT, family=FONT), bordercolor=GRID),
    )
    fig.update_xaxes(gridcolor=GRID, linecolor=GRID, zerolinecolor=GRID)
    fig.update_yaxes(gridcolor=GRID, linecolor=GRID, zerolinecolor=GRID)


def fetch_csv(url, **kwargs):
    import io
    import pandas as pd
    import requests
    r = requests.get(url, timeout=60)
    r.raise_for_status()
    return pd.read_csv(io.StringIO(r.text), **kwargs)


def fetch_json(url):
    import requests
    r = requests.get(url, timeout=60)
    r.raise_for_status()
    return r.json()

import numpy as np
import pandas as pd
import plotly.graph_objects as go
from scipy.interpolate import griddata
import warnings
warnings.filterwarnings("ignore")


def fetch_spy_options():
    """Fetch SPY option chain for all expiries."""
    try:
        import yfinance as yf
        ticker = yf.Ticker("SPY")
        expiries = ticker.options  # list of expiry date strings
        if not expiries:
            raise ValueError("no expiry dates returned")

        today = pd.Timestamp.today().normalize()
        rows = []
        # Limit to first 12 expiries to avoid rate limits
        for exp in expiries[:12]:
            try:
                calls = ticker.option_chain(exp).calls[["strike", "impliedVolatility"]]
                calls = calls[calls["impliedVolatility"] > 0.01]
                dte = (pd.Timestamp(exp) - today).days
                if dte <= 0:
                    continue
                for _, row in calls.iterrows():
                    rows.append({"strike": row["strike"], "dte": dte,
                                 "iv": row["impliedVolatility"] * 100})
            except Exception:
                continue

        if len(rows) < 20:
            raise ValueError(f"only {len(rows)} points fetched")
        return pd.DataFrame(rows)
    except Exception as e:
        print(f"  yfinance options failed ({e}), using synthetic data")
        return None


def make_synthetic():
    """Synthetic volatility surface with realistic smile + term structure."""
    rng = np.random.default_rng(42)
    # SPY ~560 as of mid-2025
    spot = 560.0
    expiries_dte = [7, 14, 30, 60, 90, 120, 150, 180, 270, 365]
    moneyness = np.linspace(0.80, 1.20, 25)
    rows = []
    for dte in expiries_dte:
        t = dte / 365.0
        atm_vol = 0.15 + 0.05 * np.exp(-dte / 90)  # term structure: higher near-term
        for m in moneyness:
            # Volatility smile: skew down for OTM puts (m < 1), slight skew for OTM calls
            skew = 0.08 * (1 - m) + 0.03 * max(m - 1, 0)
            smile = atm_vol + skew + 0.02 * (m - 1) ** 2
            noise = rng.normal(0, 0.005)
            iv = max(0.05, smile + noise) * 100
            rows.append({"strike": spot * m, "dte": dte, "iv": iv})
    return pd.DataFrame(rows)


def build_surface(df):
    """Interpolate scattered IV points onto a regular grid."""
    strike_range = (df["strike"].quantile(0.02), df["strike"].quantile(0.98))
    dte_range = (df["dte"].min(), df["dte"].max())

    n_strike, n_dte = 40, 20
    strikes_grid = np.linspace(strike_range[0], strike_range[1], n_strike)
    dte_grid = np.linspace(dte_range[0], dte_range[1], n_dte)
    sg, dg = np.meshgrid(strikes_grid, dte_grid)

    points = df[["strike", "dte"]].values
    values = df["iv"].values
    iv_interp = griddata(points, values, (sg, dg), method="linear")
    # Fill NaN with nearest
    iv_nearest = griddata(points, values, (sg, dg), method="nearest")
    iv_interp = np.where(np.isnan(iv_interp), iv_nearest, iv_interp)
    return strikes_grid, dte_grid, iv_interp


def build_fig(df):
    strikes, dte, iv_grid = build_surface(df)

    fig = go.Figure(go.Surface(
        x=strikes,
        y=dte,
        z=iv_grid,
        colorscale="Viridis",
        colorbar=dict(
            title=dict(text="Implied Vol (%)"),
            thickness=12,
        ),
        contours=dict(
            z=dict(show=True, usecolormap=True, highlightcolor="white", project_z=False),
        ),
        opacity=0.92,
    ))

    fig.update_layout(
        scene=dict(
            xaxis_title="Strike Price (USD)",
            yaxis_title="Days to Expiry",
            zaxis_title="Implied Volatility (%)",
            camera=dict(eye=dict(x=1.6, y=-1.6, z=0.8)),
            xaxis=dict(showgrid=True),
            yaxis=dict(showgrid=True),
            zaxis=dict(showgrid=True),
        ),
        margin=dict(t=40, b=20, l=10, r=10),
    )
    return fig


def generate():
    df = fetch_spy_options()
    if df is None or len(df) < 20:
        df = make_synthetic()
        print("  using synthetic volatility surface data")
    else:
        print(f"  fetched {len(df)} option quotes from yfinance")

    fig = build_fig(df)
    apply_theme(fig)
    return fig


fig = generate()
fig.show()
Made with Plotly