
Pareto chart
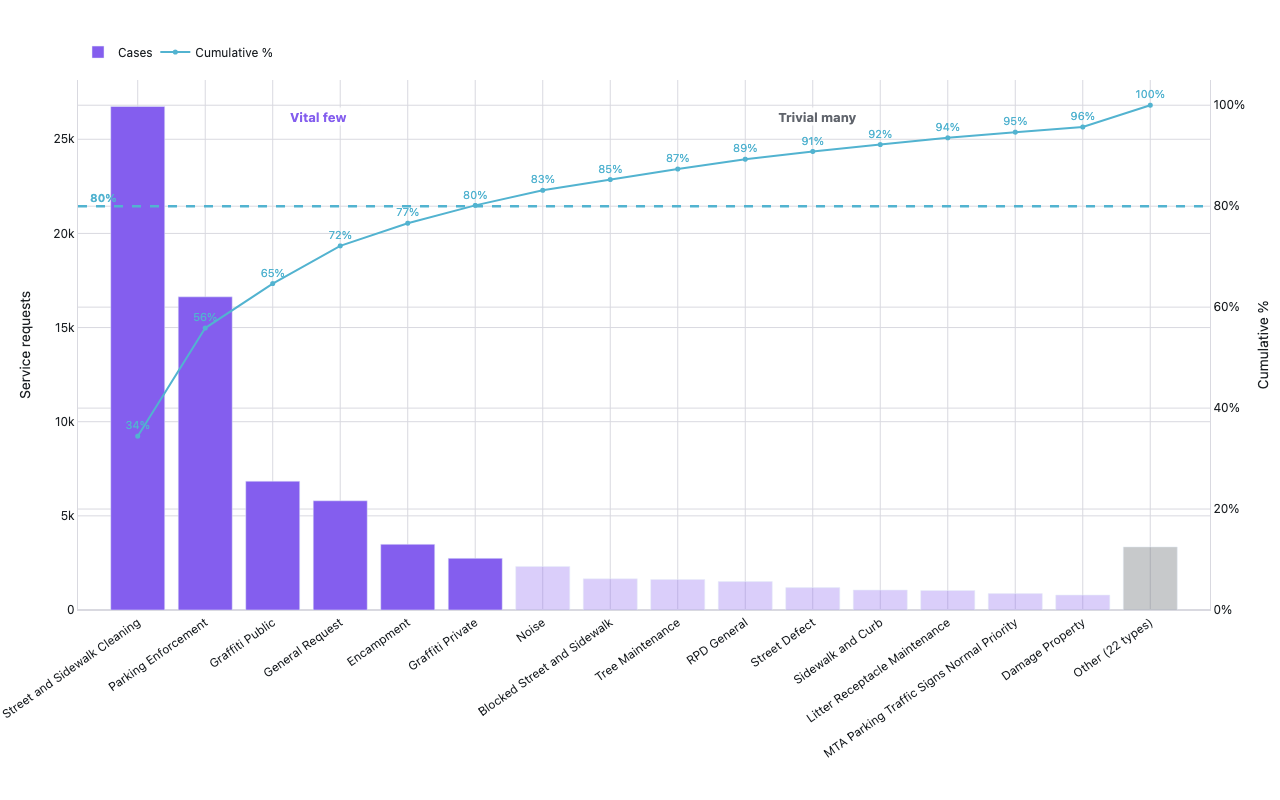
San Francisco 311 service requests by type, one full month
Example from the compendium of canonical charts
Python Code
"""Pareto chart — San Francisco 311 service requests by type, one full month.

A Pareto is a quality-control staple: sort causes by frequency, overlay the
running cumulative %, and the "vital few" categories that drive ~80% of volume
fall out on the left. SF 311 is a clean real-world example — a handful of
request types (street cleaning, parking) dominate a long tail of everything
else.
"""
from pathlib import Path

# ── Palette + theme (matching the Plotly Studio gallery these charts ship in) ──
VIOLET, TEAL, GREEN, PINK, ORANGE = "#845EEE", "#52B3D0", "#55B685", "#DA5597", "#E9A23B"
PRIMARY, SECONDARY = VIOLET, TEAL
COLORWAY = [VIOLET, TEAL, GREEN, PINK, ORANGE]
BG, TEXT, GRID, MUTED = "#ffffff", "#1c2024", "#d9d9e0", "#60646c"
FONT = "Inter, -apple-system, BlinkMacSystemFont, sans-serif"
COLORSCALE = [[0, "rgba(132, 94, 238, 0.05)"], [1, "rgba(132, 94, 238, 0.9)"]]


def apply_theme(fig):
    """Light gallery theme: white background, Inter font, soft gridlines."""
    fig.update_layout(
        paper_bgcolor=BG, plot_bgcolor=BG, colorway=COLORWAY,
        font=dict(family=FONT, color=TEXT, size=12),
        legend=dict(font=dict(color=TEXT)),
        hoverlabel=dict(bgcolor="#f0f0f3", font=dict(color=TEXT, family=FONT), bordercolor=GRID),
    )
    fig.update_xaxes(gridcolor=GRID, linecolor=GRID, zerolinecolor=GRID)
    fig.update_yaxes(gridcolor=GRID, linecolor=GRID, zerolinecolor=GRID)


def fetch_csv(url, **kwargs):
    import io
    import pandas as pd
    import requests
    r = requests.get(url, timeout=60)
    r.raise_for_status()
    return pd.read_csv(io.StringIO(r.text), **kwargs)


def fetch_json(url):
    import requests
    r = requests.get(url, timeout=60)
    r.raise_for_status()
    return r.json()

import plotly.graph_objects as go


# SF 311 Cases — https://data.sfgov.org/City-Infrastructure/311-Cases/vw6y-z8j6
# Live SoQL query: top request types for one full month, plus the grand total
# so the cumulative line is honest (a %  of *all* cases, not just the top N).
START, END = "2026-05-01", "2026-06-01"
MONTH_LABEL = "May 2026"
TOP_N = 15
BASE = "https://data.sfgov.org/resource/vw6y-z8j6.json"
WHERE = f"requested_datetime >= '{START}' AND requested_datetime < '{END}'"
URL_TOP = (
    f"{BASE}?$select=service_name,count(*) AS cnt"
    f"&$where={WHERE}"
    f"&$group=service_name&$order=cnt DESC&$limit={TOP_N}"
)
URL_TOTAL = f"{BASE}?$select=count(*) AS total&$where={WHERE}"
URL_KINDS = f"{BASE}?$select=count(DISTINCT service_name) AS kinds&$where={WHERE}"

# Real May 2026 figures (77,652 cases across 37 request types), used verbatim if
# the live API is unreachable at build time.
FALLBACK = [
    ("Street and Sidewalk Cleaning",             26740),
    ("Parking Enforcement",                      16632),
    ("Graffiti Public",                           6841),
    ("General Request",                           5800),
    ("Encampment",                                3489),
    ("Graffiti Private",                          2744),
    ("Noise",                                     2315),
    ("Blocked Street and Sidewalk",               1654),
    ("Tree Maintenance",                          1622),
    ("RPD General",                               1510),
    ("Street Defect",                             1189),
    ("Sidewalk and Curb",                         1061),
    ("Litter Receptacle Maintenance",             1039),
    ("MTA Parking Traffic Signs Normal Priority",  872),
    ("Damage Property",                            793),
]
FALLBACK_TOTAL = 77652
FALLBACK_KINDS = 37  # distinct request types that month


def generate():
    print(f"fetching SF 311 top {TOP_N} request types ({MONTH_LABEL}) …")
    try:
        rows = fetch_json(URL_TOP)
        labels = [r["service_name"] for r in rows]
        counts = [int(r["cnt"]) for r in rows]
        total = int(fetch_json(URL_TOTAL)[0]["total"])
        kinds = int(fetch_json(URL_KINDS)[0]["kinds"])
        print(f"  live: {total:,} cases across {kinds} request types")
    except Exception as e:
        print(f"  SF Open Data failed ({e}); using cached {MONTH_LABEL} figures")
        labels = [r[0] for r in FALLBACK]
        counts = [r[1] for r in FALLBACK]
        total = FALLBACK_TOTAL
        kinds = FALLBACK_KINDS

    # Roll the long tail into one "Other" bucket so every case is counted and the
    # cumulative line reaches 100%. Label it with the number of request types it
    # hides, so the "20% of causes" side of the 80/20 rule stays checkable.
    other_cnt = total - sum(counts)
    other_types = kinds - len(labels)
    has_other = other_cnt > 0 and other_types > 0
    if has_other:
        labels.append(f"Other ({other_types} types)")
        counts.append(other_cnt)

    # Cumulative % of all cases that month (with the tail folded in, the line
    # now closes at 100%).
    cum_pct = []
    running = 0
    for c in counts:
        running += c
        cum_pct.append(running / total * 100)

    n = len(labels)
    n_vital = sum(1 for p in cum_pct if p <= 80) + 1  # first bar that crosses 80%
    colors = [VIOLET if i < n_vital else "rgba(132, 94, 238, 0.3)" for i in range(n)]
    if has_other:
        colors[-1] = "rgba(96, 100, 108, 0.35)"  # neutral gray for the aggregate

    fig = go.Figure([
        go.Bar(
            x=labels,
            y=counts,
            marker_color=colors,
            name="Cases",
            yaxis="y",
            hovertemplate="%{x}<br>%{y:,} cases<extra></extra>",
        ),
        go.Scatter(
            x=labels,
            y=cum_pct,
            mode="lines+markers+text",
            name="Cumulative %",
            yaxis="y2",
            line=dict(color=TEAL, width=2),
            marker=dict(size=5),
            text=[f"{p:.0f}%" for p in cum_pct],
            textposition="top center",
            textfont=dict(color=TEAL, size=11),
            cliponaxis=False,
            hovertemplate="%{x}<br>%{y:.1f}% cumulative<extra></extra>",
        ),
    ])

    # Boundary between the "vital few" and the "trivial many", in paper
    # coordinates (the category axis splits the width into n equal slots).
    divider_x = n_vital / n

    fig.update_layout(
        xaxis=dict(tickangle=-35),
        yaxis=dict(title="Service requests"),
        yaxis2=dict(
            title="Cumulative %",
            overlaying="y",
            side="right",
            range=[0, 105],
            ticksuffix="%",
        ),
        legend=dict(orientation="h", y=1.08),
        margin=dict(t=80, b=190, l=70, r=60),
        height=520,
        shapes=[
            # 80% reference line spanning the full plot width (x on paper, y on
            # the cumulative axis so it sits at the 80% mark).
            dict(
                type="line",
                xref="paper", x0=0, x1=1,
                yref="y2", y0=80, y1=80,
                line=dict(color=TEAL, dash="dash", width=2.5),
            ),
        ],
        annotations=[
            dict(
                xref="paper", yref="paper",
                x=divider_x / 2, y=0.95,
                text="<b>Vital few</b>",
                showarrow=False,
                font=dict(color=VIOLET, size=13),
                bgcolor="rgba(255,255,255,0.85)",
            ),
            dict(
                xref="paper", yref="paper",
                x=divider_x + (1 - divider_x) / 2, y=0.95,
                text="<b>Trivial many</b>",
                showarrow=False,
                font=dict(color=MUTED, size=13),
                bgcolor="rgba(255,255,255,0.85)",
            ),
            dict(
                xref="paper", yref="y2",
                x=0.01, y=80, yshift=9,
                text="<b>80%</b>",
                showarrow=False,
                xanchor="left",
                font=dict(color=TEAL, size=11),
            ),
        ],
    )
    apply_theme(fig)
    return fig


fig = generate()
fig.show()
Made with Plotly