
P-T Phase Diagram
Thermodynamics — Water
Example from the compendium of canonical charts
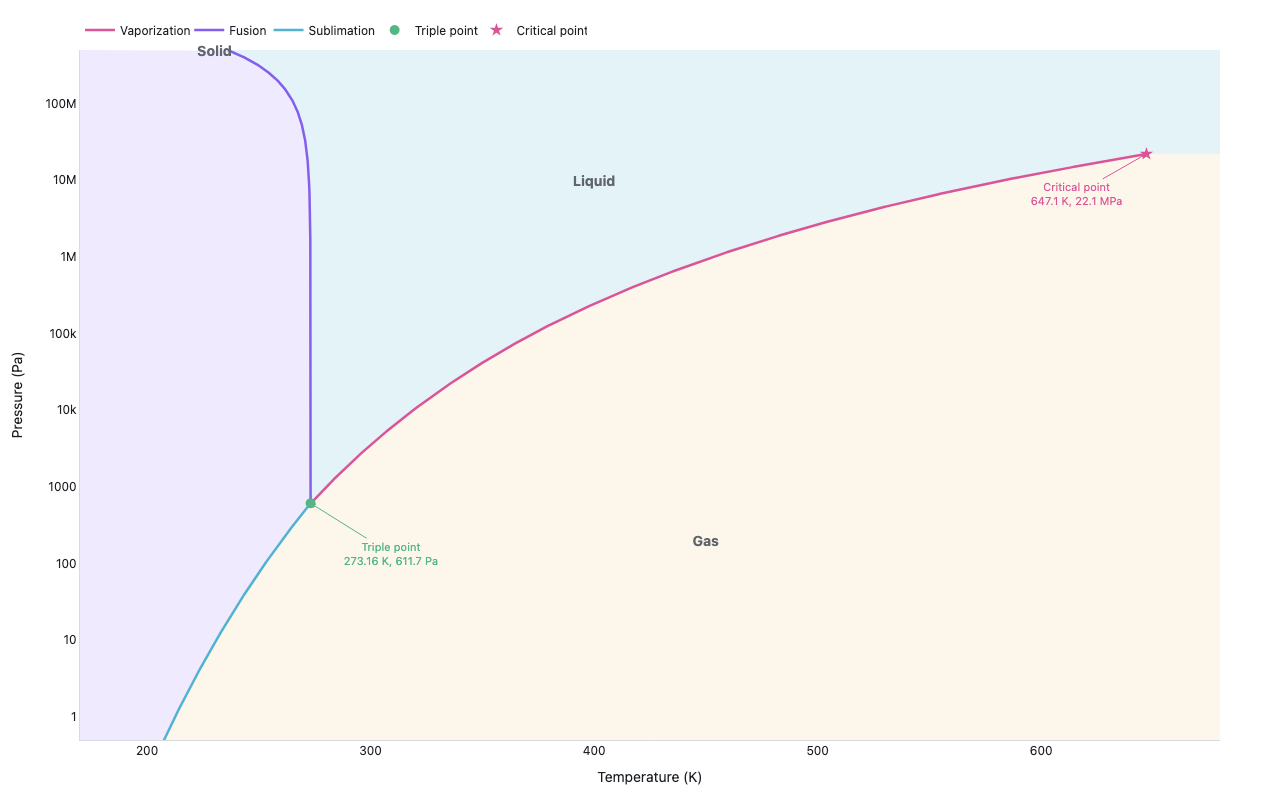
Python Code
"""Thermodynamics — P-T Phase Diagram (Water)."""
from pathlib import Path

# ── Palette + theme (matching the Plotly Studio gallery these charts ship in) ──
VIOLET, TEAL, GREEN, PINK, ORANGE = "#845EEE", "#52B3D0", "#55B685", "#DA5597", "#E9A23B"
PRIMARY, SECONDARY = VIOLET, TEAL
COLORWAY = [VIOLET, TEAL, GREEN, PINK, ORANGE]
BG, TEXT, GRID, MUTED = "#ffffff", "#1c2024", "#d9d9e0", "#60646c"
FONT = "Inter, -apple-system, BlinkMacSystemFont, sans-serif"
COLORSCALE = [[0, "rgba(132, 94, 238, 0.05)"], [1, "rgba(132, 94, 238, 0.9)"]]


def apply_theme(fig):
    """Light gallery theme: white background, Inter font, soft gridlines."""
    fig.update_layout(
        paper_bgcolor=BG, plot_bgcolor=BG, colorway=COLORWAY,
        font=dict(family=FONT, color=TEXT, size=12),
        legend=dict(font=dict(color=TEXT)),
        hoverlabel=dict(bgcolor="#f0f0f3", font=dict(color=TEXT, family=FONT), bordercolor=GRID),
    )
    fig.update_xaxes(gridcolor=GRID, linecolor=GRID, zerolinecolor=GRID)
    fig.update_yaxes(gridcolor=GRID, linecolor=GRID, zerolinecolor=GRID)


def fetch_csv(url, **kwargs):
    import io
    import pandas as pd
    import requests
    r = requests.get(url, timeout=60)
    r.raise_for_status()
    return pd.read_csv(io.StringIO(r.text), **kwargs)


def fetch_json(url):
    import requests
    r = requests.get(url, timeout=60)
    r.raise_for_status()
    return r.json()

import numpy as np
import plotly.graph_objects as go


# Physical constants
R = 8.314          # J/(mol·K)
T_tp = 273.16      # K  (triple point)
P_tp = 611.657     # Pa (triple point)
T_c = 647.096      # K  (critical point)
P_c = 22.064e6     # Pa (critical point)

# Fusion curve parameters (Clausius-Clapeyron)
dH_fus = 6010.0    # J/mol
dV_fus = -1.63e-6  # m³/mol  (negative for water)
dPdT_fusion = dH_fus / (T_tp * dV_fus)   # ≈ -1.35e7 Pa/K

# Sublimation enthalpy
dH_sub = 51059.0   # J/mol


def vaporization_curve():
    """Liquid-vapor boundary from triple point to critical point."""
    # Antoine equation (base-10, P in mmHg, T in °C)
    # For T = 1–100°C: A=8.07131, B=1730.63, C=233.426
    # For T = 99–374°C: A=8.14019, B=1810.94, C=244.485
    # Convert: P_Pa = P_mmHg * 133.322
    T_K = np.linspace(T_tp, T_c - 0.1, 500)
    T_C = T_K - 273.15

    P = np.zeros_like(T_K)
    for i, (Tc, Tk) in enumerate(zip(T_C, T_K)):
        if Tc <= 100:
            A, B, C = 8.07131, 1730.63, 233.426
            P_mmHg = 10 ** (A - B / (C + Tc))
            P[i] = P_mmHg * 133.322
        else:
            # Buck equation extended: ln(P_Pa) = f(T)
            # Approximation: use NIST-like Antoine for high T
            A, B, C = 8.14019, 1810.94, 244.485
            P_mmHg = 10 ** (A - B / (C + Tc))
            P[i] = P_mmHg * 133.322

    # Force endpoint at critical point
    P[-1] = P_c
    # Smooth by ensuring monotone approach
    return T_K, P


def fusion_curve():
    """Solid-liquid boundary (melting curve)."""
    T_K = np.linspace(173.0, T_tp, 300)
    P = P_tp + dPdT_fusion * (T_K - T_tp)
    P = np.maximum(P, 1.0)
    return T_K, P


def sublimation_curve():
    """Solid-vapor boundary (sublimation curve)."""
    T_K = np.linspace(180.0, T_tp, 300)
    # Clausius-Clapeyron: dP/dT = P * dH_sub / (R * T^2)
    # => ln(P/P_tp) = -dH_sub/R * (1/T - 1/T_tp)
    P = P_tp * np.exp(-dH_sub / R * (1.0 / T_K - 1.0 / T_tp))
    return T_K, P


def generate():
    print("computing water P-T phase diagram …")

    T_vap, P_vap = vaporization_curve()
    T_fus, P_fus = fusion_curve()
    T_sub, P_sub = sublimation_curve()

    fig = go.Figure()

    # Region shading (approximate rectangular fills on log-P axis)
    P_plot_min = 0.4
    # Gas: full background (orange/amber tint)
    fig.add_shape(type="rect", x0=170, x1=680, y0=np.log10(P_plot_min), y1=np.log10(5e8),
                  fillcolor="rgba(233,162,59,0.12)", line_width=0, layer="below")
    # Liquid: upper-right (blue tint)
    fig.add_shape(type="rect", x0=273.16, x1=648, y0=np.log10(P_tp), y1=np.log10(2.5e7),
                  fillcolor="rgba(82,179,208,0.2)", line_width=0, layer="below")
    # Solid: upper-left (violet tint)
    fig.add_shape(type="rect", x0=170, x1=273.5, y0=np.log10(P_tp), y1=np.log10(5e8),
                  fillcolor="rgba(132,94,238,0.15)", line_width=0, layer="below")

    # Vaporization (liquid-vapor)
    fig.add_trace(go.Scatter(
        x=T_vap, y=P_vap,
        mode="lines",
        line=dict(color=PINK, width=2.5),
        name="Vaporization",
        hovertemplate="T=%{x:.1f} K<br>P=%{y:.1e} Pa<extra></extra>",
    ))

    # Fusion (solid-liquid)
    fig.add_trace(go.Scatter(
        x=T_fus, y=P_fus,
        mode="lines",
        line=dict(color=VIOLET, width=2.5),
        name="Fusion",
        hovertemplate="T=%{x:.1f} K<br>P=%{y:.1e} Pa<extra></extra>",
    ))

    # Sublimation (solid-vapor)
    fig.add_trace(go.Scatter(
        x=T_sub, y=P_sub,
        mode="lines",
        line=dict(color=TEAL, width=2.5),
        name="Sublimation",
        hovertemplate="T=%{x:.1f} K<br>P=%{y:.1e} Pa<extra></extra>",
    ))

    # Triple point marker
    fig.add_trace(go.Scatter(
        x=[T_tp], y=[P_tp],
        mode="markers",
        marker=dict(size=10, color=GREEN, symbol="circle"),
        name="Triple point",
        hovertemplate=f"Triple point<br>T={T_tp} K<br>P={P_tp:.1f} Pa<extra></extra>",
    ))

    # Critical point marker
    fig.add_trace(go.Scatter(
        x=[T_c], y=[P_c],
        mode="markers",
        marker=dict(size=10, color="#DA5597", symbol="star"),
        name="Critical point",
        hovertemplate=f"Critical point<br>T={T_c} K<br>P={P_c:.2e} Pa<extra></extra>",
    ))

    # Annotations
    annotations = [
        dict(
            x=T_tp, y=np.log10(P_tp),
            xref="x", yref="y",
            text="Triple point<br>273.16 K, 611.7 Pa",
            showarrow=True,
            arrowhead=2,
            ax=80, ay=50,
            font=dict(size=11, color=GREEN),
            arrowcolor=GREEN,
        ),
        dict(
            x=T_c, y=np.log10(P_c),
            xref="x", yref="y",
            text="Critical point<br>647.1 K, 22.1 MPa",
            showarrow=True,
            arrowhead=2,
            ax=-70, ay=40,
            font=dict(size=11, color="#DA5597"),
            arrowcolor="#DA5597",
        ),
        # Region labels
        dict(
            x=230, y=np.log10(5e8),
            xref="x", yref="y",
            text="<b>Solid</b>",
            showarrow=False,
            font=dict(size=14, color=MUTED),
        ),
        dict(
            x=400, y=np.log10(1e7),
            xref="x", yref="y",
            text="<b>Liquid</b>",
            showarrow=False,
            font=dict(size=14, color=MUTED),
        ),
        dict(
            x=450, y=np.log10(200),
            xref="x", yref="y",
            text="<b>Gas</b>",
            showarrow=False,
            font=dict(size=14, color=MUTED),
        ),
    ]

    fig.update_layout(
        xaxis=dict(
            title="Temperature (K)",
            range=[170, 680],
            showgrid=False,
        ),
        yaxis=dict(
            title="Pressure (Pa)",
            type="log",
            range=[np.log10(0.5), np.log10(5e8)],
            showgrid=False,
        ),
        annotations=annotations,
        legend=dict(orientation="h", y=1.05, x=0),
        margin=dict(t=50, b=60, l=80, r=60),
    )

    apply_theme(fig)
    return fig


fig = generate()
fig.show()
Made with Plotly