
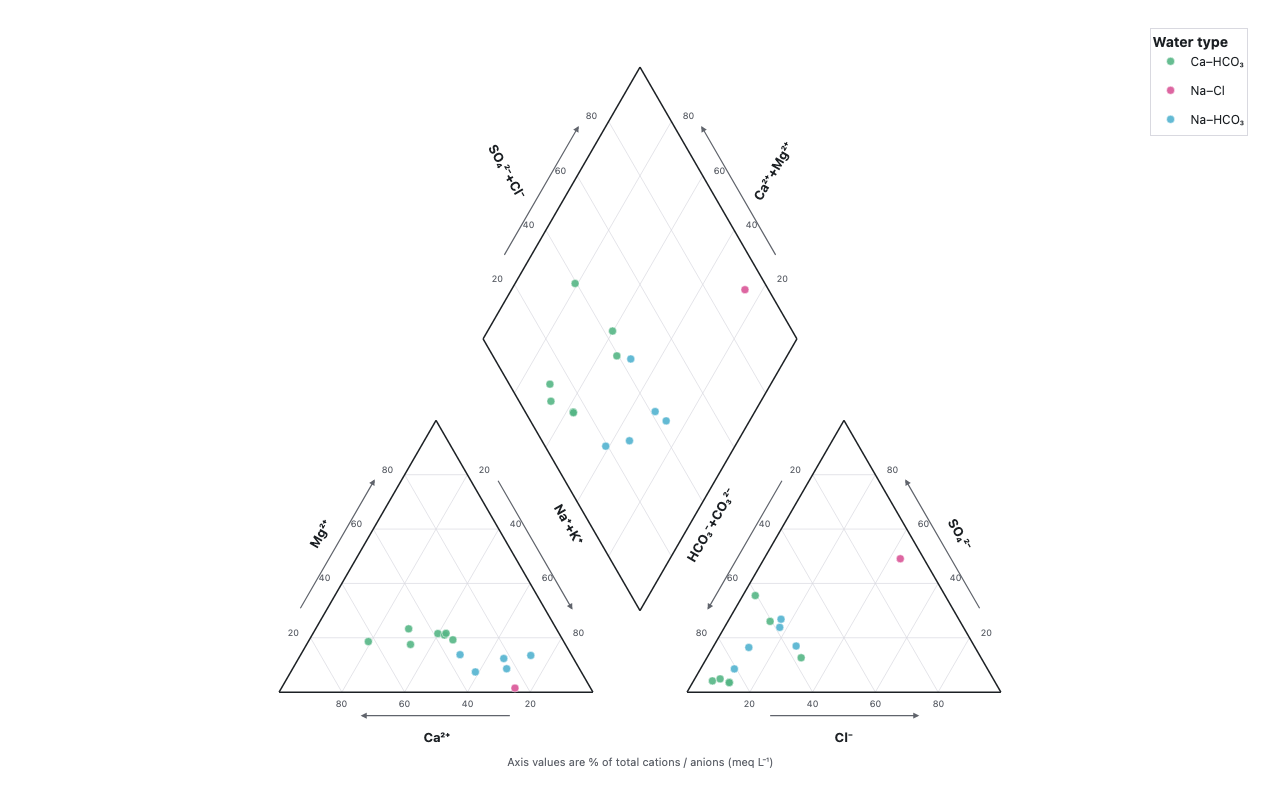
Piper diagram
USGS groundwater major-ion chemistry, New Mexico
Example from the compendium of canonical charts
Python Code
"""Piper diagram — USGS groundwater major-ion chemistry, New Mexico."""
from pathlib import Path

# ── Palette + theme (matching the Plotly Studio gallery these charts ship in) ──
VIOLET, TEAL, GREEN, PINK, ORANGE = "#845EEE", "#52B3D0", "#55B685", "#DA5597", "#E9A23B"
PRIMARY, SECONDARY = VIOLET, TEAL
COLORWAY = [VIOLET, TEAL, GREEN, PINK, ORANGE]
BG, TEXT, GRID, MUTED = "#ffffff", "#1c2024", "#d9d9e0", "#60646c"
FONT = "Inter, -apple-system, BlinkMacSystemFont, sans-serif"
COLORSCALE = [[0, "rgba(132, 94, 238, 0.05)"], [1, "rgba(132, 94, 238, 0.9)"]]


def apply_theme(fig):
    """Light gallery theme: white background, Inter font, soft gridlines."""
    fig.update_layout(
        paper_bgcolor=BG, plot_bgcolor=BG, colorway=COLORWAY,
        font=dict(family=FONT, color=TEXT, size=12),
        legend=dict(font=dict(color=TEXT)),
        hoverlabel=dict(bgcolor="#f0f0f3", font=dict(color=TEXT, family=FONT), bordercolor=GRID),
    )
    fig.update_xaxes(gridcolor=GRID, linecolor=GRID, zerolinecolor=GRID)
    fig.update_yaxes(gridcolor=GRID, linecolor=GRID, zerolinecolor=GRID)


def fetch_csv(url, **kwargs):
    import io
    import pandas as pd
    import requests
    r = requests.get(url, timeout=60)
    r.raise_for_status()
    return pd.read_csv(io.StringIO(r.text), **kwargs)


def fetch_json(url):
    import requests
    r = requests.get(url, timeout=60)
    r.raise_for_status()
    return r.json()

import numpy as np
import pandas as pd
import plotly.graph_objects as go

URL = (
    "https://www.waterqualitydata.us/data/Result/search"
    "?statecode=US%3A35&countycode=US%3A35%3A028"
    "&characteristicName=Calcium&characteristicName=Magnesium"
    "&characteristicName=Sodium&characteristicName=Chloride"
    "&characteristicName=Sulfate&characteristicName=Bicarbonate"
    "&mimeType=csv&zip=no&dataProfile=resultPhysChem&providers=NWIS"
)

# Equivalent weights (g/eq) — convert mg/L → meq/L before plotting ion ratios.
EW = {"Calcium": 20.04, "Magnesium": 12.15, "Sodium": 22.99,
      "Chloride": 35.45, "Sulfate": 48.03, "Bicarbonate": 61.02}

# ── Piper geometry (single shared cartesian frame) ─────────────────────────────
# All three panels share one cartesian coordinate system. The two base triangles
# are ternary plots (barycentric placement on a 3-component simplex); the diamond
# is a sheared 2-axis grid on %(Na+K) × %(SO4+Cl). Each sample is shown in all
# three. A single gap G sets the whole composition: the diamond sits at the
# projection intersection, nestling down into the gap with its lower edges
# parallel to the triangles' inner edges (bottom vertex at height H·G, a
# perpendicular gap H·G from each inner edge). Smaller G ⇒ tighter and lower.
H = np.sqrt(3) / 2          # apex height of a unit-side triangle
G = 0.30                    # gap between the two triangles
TICKS = [0.2, 0.4, 0.6, 0.8]

# Cation triangle: Ca (bottom-left), Na+K (bottom-right), Mg (apex)
CA, NAK, MG = (0.0, 0.0), (1.0, 0.0), (0.5, H)
# Anion triangle: HCO3+CO3 (bottom-left), Cl (bottom-right), SO4 (apex)
HCO3, CL, SO4 = (1 + G, 0.0), (2 + G, 0.0), (1.5 + G, H)
# Diamond centre + corners (at the projection intersection above the gap).
DCX, DCY = 1 + G / 2, H * (1 + G)
D_BOT = (DCX, H * G)
D_TOP = (DCX, H * (2 + G))
D_LEFT = (DCX - 0.5, DCY)
D_RIGHT = (DCX + 0.5, DCY)

# Standard hydrochemical facies → theme colours
TYPE_COLORS = {
    "Ca–HCO₃":  GREEN,
    "Na–Cl":    PINK,
    "Ca–Cl":    ORANGE,
    "Na–HCO₃":  TEAL,
    "Mixed":    VIOLET,
}


def _lerp(p, q, t):
    return (p[0] + (q[0] - p[0]) * t, p[1] + (q[1] - p[1]) * t)


def _tri_xy(fl, fr, ft, vl, vr, vt):
    """Barycentric point in a triangle: fractions (sum=1) on (left, right, top)."""
    return (fl * vl[0] + fr * vr[0] + ft * vt[0],
            fl * vl[1] + fr * vr[1] + ft * vt[1])


def _diamond_xy(nak, so4cl):
    """Place a sample in the diamond from %(Na+K) and %(SO4+Cl) (fractions).

    Bottom = Na–HCO₃, left = Ca–HCO₃, right = Na–Cl, top = Ca–Cl.
    """
    return (DCX + 0.5 * (nak + so4cl - 1), DCY + H * (so4cl - nak))


# ── Synthetic fallback ─────────────────────────────────────────────────────────
def _synthetic():
    """Representative clustered groundwater (meq/L) if the WQP fetch fails."""
    rng = np.random.default_rng(42)
    # cluster centres in meq/L: (Ca, Mg, Na, HCO3, SO4, Cl, n)
    clusters = [
        (3.5, 1.2, 0.8, 4.0, 0.8, 0.5, 16),   # Ca–HCO3 fresh recharge
        (1.0, 0.6, 6.0, 1.2, 1.5, 5.5, 14),   # Na–Cl saline
        (2.2, 1.4, 2.6, 2.4, 2.0, 2.2, 12),   # mixed
    ]
    rows = []
    for ca, mg, na, hco3, so4, cl, n in clusters:
        for _ in range(n):
            j = lambda v: max(0.05, v * rng.uniform(0.6, 1.4))
            rows.append({"Ca": j(ca), "Mg": j(mg), "Na": j(na),
                         "HCO3": j(hco3), "SO4": j(so4), "Cl": j(cl)})
    return pd.DataFrame(rows)


def generate():
    print("fetching USGS Water Quality Portal NM major ions …")
    df = None
    try:
        df_raw = fetch_csv(URL, low_memory=False)
        df = _parse_wqp(df_raw)
    except Exception as e:
        print(f"  WQP fetch failed ({e})")

    if df is None or len(df) == 0:
        print("  using synthetic representative data")
        df = _synthetic()

    _plot_piper(df)


def _parse_wqp(df_raw):
    ion_cols = ["Calcium", "Magnesium", "Sodium", "Chloride", "Sulfate", "Bicarbonate"]
    needed = ["MonitoringLocationIdentifier", "ActivityStartDate",
              "CharacteristicName", "ResultMeasureValue"]
    available = [c for c in needed if c in df_raw.columns]
    if len(available) < 4:
        print(f"  unexpected columns: {list(df_raw.columns[:10])}")
        return None

    df_raw = df_raw[available].copy()
    df_raw = df_raw[df_raw["CharacteristicName"].isin(ion_cols)]
    df_raw["ResultMeasureValue"] = pd.to_numeric(df_raw["ResultMeasureValue"], errors="coerce")
    df_raw = df_raw.dropna(subset=["ResultMeasureValue"])

    pivot = df_raw.pivot_table(
        index=["MonitoringLocationIdentifier", "ActivityStartDate"],
        columns="CharacteristicName",
        values="ResultMeasureValue",
        aggfunc="mean",
    ).reset_index()
    pivot.columns.name = None

    for ion in ion_cols:
        if ion not in pivot.columns:
            pivot[ion] = np.nan
    pivot = pivot.dropna(subset=ion_cols)
    if len(pivot) == 0:
        return None

    # mg/L → meq/L
    return pd.DataFrame({
        "Ca":   pivot["Calcium"] / EW["Calcium"],
        "Mg":   pivot["Magnesium"] / EW["Magnesium"],
        "Na":   pivot["Sodium"] / EW["Sodium"],
        "HCO3": pivot["Bicarbonate"] / EW["Bicarbonate"],
        "SO4":  pivot["Sulfate"] / EW["Sulfate"],
        "Cl":   pivot["Chloride"] / EW["Chloride"],
    })


def _classify(camg, hco3):
    """Five standard Piper water types from cation/anion dominance (%)."""
    nak, so4cl = 100 - camg, 100 - hco3
    if camg > 50 and hco3 > 50:
        return "Ca–HCO₃"
    if nak > 50 and so4cl > 50:
        return "Na–Cl"
    if camg > 50 and so4cl > 50:
        return "Ca–Cl"
    if nak > 50 and hco3 > 50:
        return "Na–HCO₃"
    return "Mixed"


# ── Frame: outlines, grids, ticks, axis titles, direction arrows ───────────────
def _line(x0, y0, x1, y1, color, width):
    return dict(type="line", x0=x0, y0=y0, x1=x1, y1=y1,
                line=dict(color=color, width=width), layer="below")


def _frame_shapes():
    shapes = []
    # 20 % grid lines inside each triangle.
    for vl, vr, vt in [(CA, NAK, MG), (HCO3, CL, SO4)]:
        for k in TICKS:
            for a, b in [
                (_lerp(vl, vr, k), _lerp(vl, vt, k)),
                (_lerp(vr, vl, k), _lerp(vr, vt, k)),
                (_lerp(vt, vl, k), _lerp(vt, vr, k)),
            ]:
                shapes.append(_line(a[0], a[1], b[0], b[1], GRID, 0.7))
    # Diamond grid (constant Na+K and constant SO4+Cl).
    for k in TICKS:
        a, b = _diamond_xy(k, 0), _diamond_xy(k, 1)
        shapes.append(_line(a[0], a[1], b[0], b[1], GRID, 0.7))
        a, b = _diamond_xy(0, k), _diamond_xy(1, k)
        shapes.append(_line(a[0], a[1], b[0], b[1], GRID, 0.7))
    # Outlines.
    for tri in [(CA, NAK, MG), (HCO3, CL, SO4)]:
        for i in range(3):
            p, q = tri[i], tri[(i + 1) % 3]
            shapes.append(_line(p[0], p[1], q[0], q[1], TEXT, 1.5))
    diamond = [D_BOT, D_RIGHT, D_TOP, D_LEFT, D_BOT]
    for p, q in zip(diamond, diamond[1:]):
        shapes.append(_line(p[0], p[1], q[0], q[1], TEXT, 1.5))
    return shapes


def _normal(vstart, vend, opposite, dist):
    """Unit outward normal of edge vstart→vend (pointing away from `opposite`)."""
    ex, ey = vend[0] - vstart[0], vend[1] - vstart[1]
    nx, ny = -ey, ex
    n = np.hypot(nx, ny)
    nx, ny = nx / n, ny / n
    mx, my = (vstart[0] + vend[0]) / 2, (vstart[1] + vend[1]) / 2
    if (mx - opposite[0]) * nx + (my - opposite[1]) * ny < 0:
        nx, ny = -nx, -ny
    return nx * dist, ny * dist


def _edge_tick(vstart, vend, opposite, value):
    """Tick for `value` (fraction) where the component runs 0 at vstart → 1 at vend."""
    p = _lerp(vstart, vend, value)
    ox, oy = _normal(vstart, vend, opposite, 0.035)
    xa = "right" if ox < -0.005 else ("left" if ox > 0.005 else "center")
    return dict(x=p[0] + ox, y=p[1] + oy, text=f"{int(value * 100)}",
                showarrow=False, font=dict(size=9, color=MUTED),
                xanchor=xa, yanchor="middle")


def _axis_arrow(vstart, vend, opposite, od=0.075, span=0.24):
    """Arrow alongside an edge pointing vstart→vend (direction of increase)."""
    ex, ey = vend[0] - vstart[0], vend[1] - vstart[1]
    e = np.hypot(ex, ey)
    ex, ey = ex / e, ey / e
    nx, ny = _normal(vstart, vend, opposite, od)
    mx, my = (vstart[0] + vend[0]) / 2 + nx, (vstart[1] + vend[1]) / 2 + ny
    return dict(x=mx + ex * span, y=my + ey * span,
                ax=mx - ex * span, ay=my - ey * span,
                xref="x", yref="y", axref="x", ayref="y", text="",
                showarrow=True, arrowhead=2, arrowsize=1, arrowwidth=1.2,
                arrowcolor=MUTED)


def _axis_title(vstart, vend, opposite, text, dist, angle):
    mx, my = (vstart[0] + vend[0]) / 2, (vstart[1] + vend[1]) / 2
    ox, oy = _normal(vstart, vend, opposite, dist)
    return dict(x=mx + ox, y=my + oy, text=f"<b>{text}</b>", showarrow=False,
                font=dict(size=13, color=TEXT), textangle=angle,
                xanchor="center", yanchor="middle")


def _frame_annotations():
    ann = []
    # (vstart, vend, opposite, title, title-angle): component 0 at vstart → 100 at vend.
    axes = [
        (NAK, CA, MG, "Ca²⁺", 0),
        (CA, MG, NAK, "Mg²⁺", -60),
        (MG, NAK, CA, "Na⁺+K⁺", 60),
        (HCO3, CL, SO4, "Cl⁻", 0),
        (SO4, HCO3, CL, "HCO₃⁻+CO₃²⁻", -60),
        (CL, SO4, HCO3, "SO₄²⁻", 60),
        (D_LEFT, D_TOP, D_RIGHT, "SO₄²⁻+Cl⁻", 60),
        (D_RIGHT, D_TOP, D_LEFT, "Ca²⁺+Mg²⁺", -60),
    ]
    for vs, ve, op, title, angle in axes:
        for k in TICKS:
            ann.append(_edge_tick(vs, ve, op, k))
        ann.append(_axis_arrow(vs, ve, op))
        ann.append(_axis_title(vs, ve, op, title, 0.20 if "+" in title else 0.14, angle))
    return ann


def _plot_piper(df):
    df = df.copy()
    cat = df["Ca"] + df["Mg"] + df["Na"]
    an = df["HCO3"] + df["SO4"] + df["Cl"]
    df = df[(cat > 0) & (an > 0)]
    cat, an = cat[df.index], an[df.index]

    df["ca"] = df["Ca"] / cat
    df["mg"] = df["Mg"] / cat
    df["nak"] = df["Na"] / cat
    df["hco3"] = df["HCO3"] / an
    df["so4"] = df["SO4"] / an
    df["cl"] = df["Cl"] / an
    df["so4cl"] = df["so4"] + df["cl"]
    df["type"] = [_classify((ca + mg) * 100, h * 100)
                  for ca, mg, h in zip(df["ca"], df["mg"], df["hco3"])]
    print(f"  plotting {len(df)} samples")

    fig = go.Figure()

    for wtype, color in TYPE_COLORS.items():
        sub = df[df["type"] == wtype]
        if len(sub) == 0:
            continue

        cat_pts = [_tri_xy(r.ca, r.nak, r.mg, CA, NAK, MG) for r in sub.itertuples()]
        an_pts = [_tri_xy(r.hco3, r.cl, r.so4, HCO3, CL, SO4) for r in sub.itertuples()]
        di_pts = [_diamond_xy(r.nak, r.so4cl) for r in sub.itertuples()]

        marker = dict(color=color, size=8, opacity=0.9,
                      line=dict(color="white", width=0.5))
        hover = [
            (f"<b>{wtype}</b><br>Ca {r.ca*100:.0f}%  Mg {r.mg*100:.0f}%  "
             f"Na+K {r.nak*100:.0f}%<br>HCO₃ {r.hco3*100:.0f}%  "
             f"SO₄ {r.so4*100:.0f}%  Cl {r.cl*100:.0f}%<extra></extra>")
            for r in sub.itertuples()
        ]
        for i, pts in enumerate((cat_pts, an_pts, di_pts)):
            xs, ys = zip(*pts)
            fig.add_trace(go.Scatter(
                x=xs, y=ys, mode="markers", marker=marker, name=wtype,
                legendgroup=wtype, showlegend=(i == 0), hovertemplate=hover))

    annotations = _frame_annotations()
    annotations.append(dict(
        x=DCX, y=-0.22, xref="x", yref="y", showarrow=False,
        text="Axis values are % of total cations / anions (meq L⁻¹)",
        font=dict(size=11, color=MUTED), xanchor="center"))

    fig.update_layout(
        shapes=_frame_shapes(),
        annotations=annotations,
        xaxis=dict(visible=False, range=[-0.25, 2 + G + 0.25],
                   scaleanchor="y", scaleratio=1, constrain="domain"),
        yaxis=dict(visible=False, range=[-0.28, H * (2 + G) + 0.15],
                   constrain="domain"),
        legend=dict(title="<b>Water type</b>", x=0.99, y=0.99,
                    xanchor="right", yanchor="top",
                    bgcolor="rgba(255,255,255,0.7)", bordercolor=GRID, borderwidth=1),
        margin=dict(t=20, b=20, l=20, r=20),
    )
    apply_theme(fig)
    return fig


fig = generate()
fig.show()
Made with Plotly