
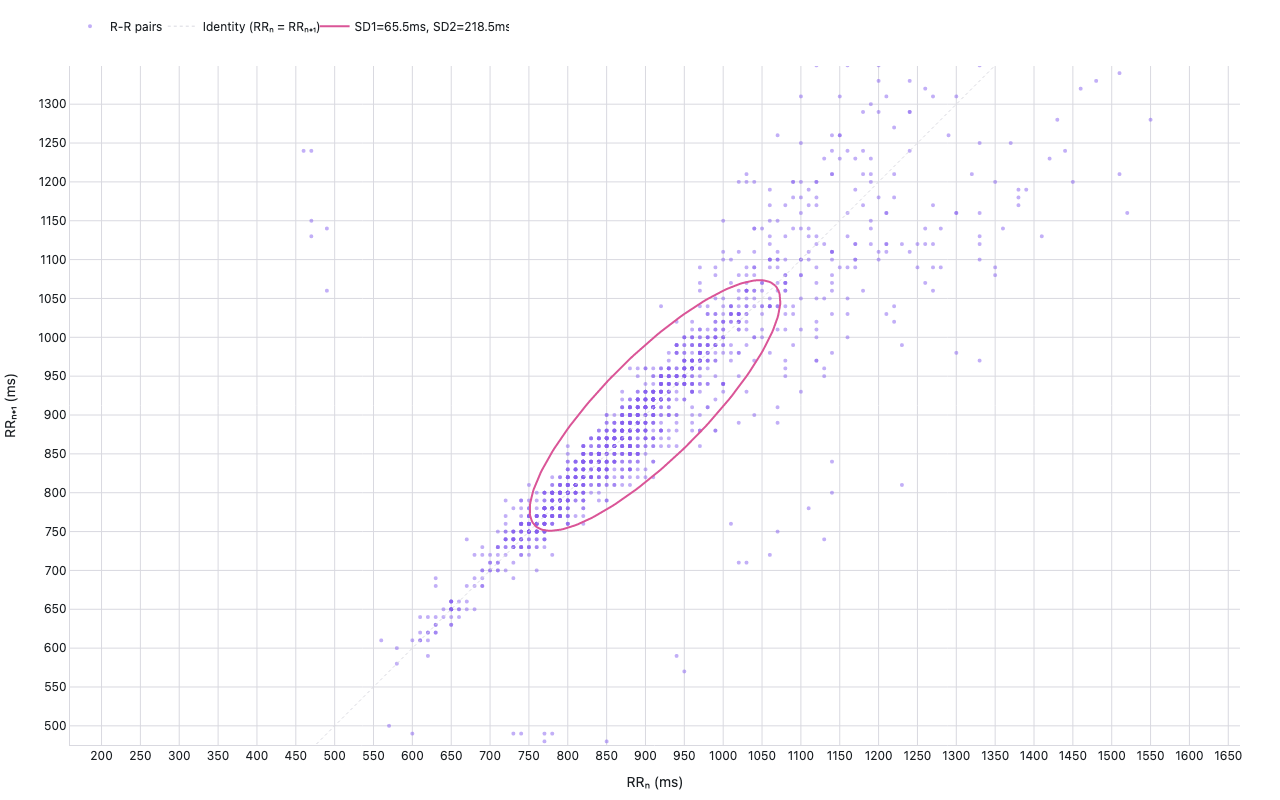
Poincaré plot
real R-R interval series with SD1/SD2 ellipse
Example from the compendium of canonical charts
Python Code
"""Poincaré plot — real R-R interval series with SD1/SD2 ellipse."""
from pathlib import Path

# ── Palette + theme (matching the Plotly Studio gallery these charts ship in) ──
VIOLET, TEAL, GREEN, PINK, ORANGE = "#845EEE", "#52B3D0", "#55B685", "#DA5597", "#E9A23B"
PRIMARY, SECONDARY = VIOLET, TEAL
COLORWAY = [VIOLET, TEAL, GREEN, PINK, ORANGE]
BG, TEXT, GRID, MUTED = "#ffffff", "#1c2024", "#d9d9e0", "#60646c"
FONT = "Inter, -apple-system, BlinkMacSystemFont, sans-serif"
COLORSCALE = [[0, "rgba(132, 94, 238, 0.05)"], [1, "rgba(132, 94, 238, 0.9)"]]


def apply_theme(fig):
    """Light gallery theme: white background, Inter font, soft gridlines."""
    fig.update_layout(
        paper_bgcolor=BG, plot_bgcolor=BG, colorway=COLORWAY,
        font=dict(family=FONT, color=TEXT, size=12),
        legend=dict(font=dict(color=TEXT)),
        hoverlabel=dict(bgcolor="#f0f0f3", font=dict(color=TEXT, family=FONT), bordercolor=GRID),
    )
    fig.update_xaxes(gridcolor=GRID, linecolor=GRID, zerolinecolor=GRID)
    fig.update_yaxes(gridcolor=GRID, linecolor=GRID, zerolinecolor=GRID)


def fetch_csv(url, **kwargs):
    import io
    import pandas as pd
    import requests
    r = requests.get(url, timeout=60)
    r.raise_for_status()
    return pd.read_csv(io.StringIO(r.text), **kwargs)


def fetch_json(url):
    import requests
    r = requests.get(url, timeout=60)
    r.raise_for_status()
    return r.json()

import numpy as np
import plotly.graph_objects as go
import requests, warnings

URL = "https://raw.githubusercontent.com/RHRV-team/RHRVBook/main/data/Chapter6/rr.txt"


def generate():
    print("fetching R-R interval series …")
    warnings.filterwarnings("ignore")
    requests.packages.urllib3.disable_warnings()
    r = requests.get(URL, verify=False, timeout=30)
    r.raise_for_status()

    # File is plain numbers (seconds), one per line or space-separated
    values = []
    for line in r.text.strip().split("\n"):
        for token in line.split():
            try:
                values.append(float(token))
            except ValueError:
                pass

    rr = np.array(values) * 1000   # seconds → ms
    print(f"  {len(rr)} R-R intervals, mean={rr.mean():.1f}ms, range=[{rr.min():.0f},{rr.max():.0f}]ms")

    rr_n  = rr[:-1]
    rr_n1 = rr[1:]

    # SD1 = std of perpendicular (short-term variability)
    # SD2 = std along the diagonal (long-term variability)
    diff  = rr_n1 - rr_n
    sumv  = rr_n1 + rr_n
    sd1   = np.std(diff, ddof=1) / np.sqrt(2)
    sd2   = np.std(sumv, ddof=1) / np.sqrt(2)
    mean_rr = np.mean(rr_n)

    print(f"  SD1={sd1:.2f}ms, SD2={sd2:.2f}ms")

    # Ellipse parametric: center=(mean_rr, mean_rr), semi-axes SD2, SD1, rotated 45°
    theta = np.linspace(0, 2 * np.pi, 200)
    # Rotated ellipse: 45°
    cos45 = np.cos(np.pi / 4)
    sin45 = np.sin(np.pi / 4)
    ex = sd2 * np.cos(theta)
    ey = sd1 * np.sin(theta)
    ell_x = mean_rr + cos45 * ex - sin45 * ey
    ell_y = mean_rr + sin45 * ex + cos45 * ey

    fig = go.Figure()

    # Scatter cloud (subsample for display)
    sample_n = min(1500, len(rr_n))
    idx = np.random.default_rng(42).choice(len(rr_n), sample_n, replace=False)
    fig.add_trace(go.Scatter(
        x=rr_n[idx], y=rr_n1[idx],
        mode="markers",
        marker=dict(color=VIOLET, size=4, opacity=0.5),
        name="R-R pairs",
        hovertemplate="RRₙ=%{x:.0f}ms<br>RRₙ₊₁=%{y:.0f}ms<extra></extra>",
    ))

    # Identity line
    lim = [rr.min() - 50, rr.max() + 50]
    fig.add_trace(go.Scatter(
        x=lim, y=lim,
        mode="lines", name="Identity (RRₙ = RRₙ₊₁)",
        line=dict(color=GRID, width=1, dash="dot"),
        hoverinfo="skip",
    ))

    # SD1/SD2 ellipse
    fig.add_trace(go.Scatter(
        x=ell_x, y=ell_y,
        mode="lines",
        line=dict(color=PINK, width=2),
        name=f"SD1={sd1:.1f}ms, SD2={sd2:.1f}ms",
        hoverinfo="skip",
    ))

    # Equal axis range so gridlines align symmetrically
    rr_center = float(mean_rr)
    rr_half = max(sd2 * 2.0, 60)
    ax_range = [rr_center - rr_half, rr_center + rr_half]

    # Align dtick to a round value so gridlines land on clean ms boundaries
    tick_step = 25 if rr_half < 100 else 50

    fig.update_layout(
        title=dict(text="Poincaré Plot — R-R Intervals with SD1/SD2 Ellipse", x=0.5),
        xaxis=dict(title="RRₙ (ms)", scaleanchor="y", scaleratio=1,
                   range=ax_range, dtick=tick_step),
        yaxis=dict(title="RRₙ₊₁ (ms)", range=ax_range, dtick=tick_step),
        legend=dict(orientation="h", y=1.08),
        margin=dict(t=60, b=50, l=70, r=40),
        height=500,
    )
    apply_theme(fig)
    return fig


fig = generate()
fig.show()
Made with Plotly