
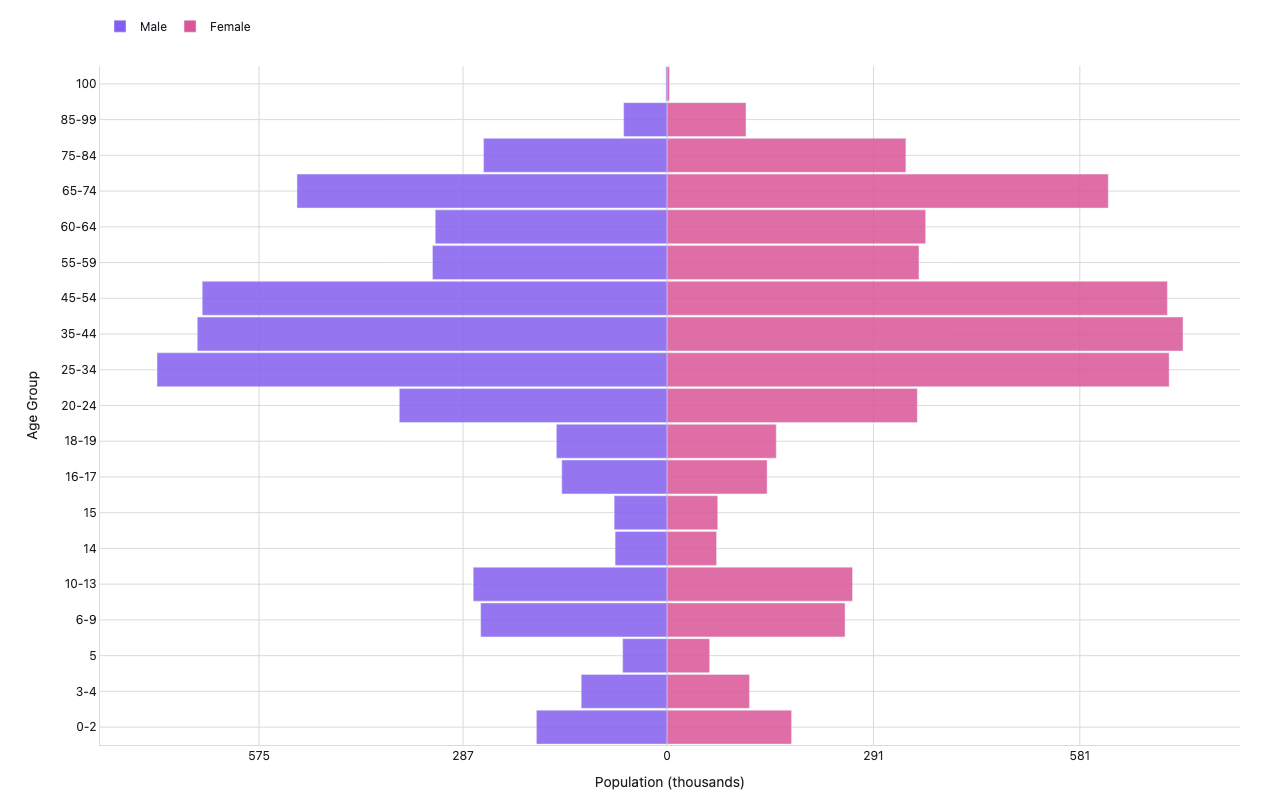
Population pyramid
California age × sex, semicolon + UTF-8 BOM CSV
Example from the compendium of canonical charts
Python Code
"""Population pyramid — California age × sex, semicolon + UTF-8 BOM CSV."""
from pathlib import Path

# ── Palette + theme (matching the Plotly Studio gallery these charts ship in) ──
VIOLET, TEAL, GREEN, PINK, ORANGE = "#845EEE", "#52B3D0", "#55B685", "#DA5597", "#E9A23B"
PRIMARY, SECONDARY = VIOLET, TEAL
COLORWAY = [VIOLET, TEAL, GREEN, PINK, ORANGE]
BG, TEXT, GRID, MUTED = "#ffffff", "#1c2024", "#d9d9e0", "#60646c"
FONT = "Inter, -apple-system, BlinkMacSystemFont, sans-serif"
COLORSCALE = [[0, "rgba(132, 94, 238, 0.05)"], [1, "rgba(132, 94, 238, 0.9)"]]


def apply_theme(fig):
    """Light gallery theme: white background, Inter font, soft gridlines."""
    fig.update_layout(
        paper_bgcolor=BG, plot_bgcolor=BG, colorway=COLORWAY,
        font=dict(family=FONT, color=TEXT, size=12),
        legend=dict(font=dict(color=TEXT)),
        hoverlabel=dict(bgcolor="#f0f0f3", font=dict(color=TEXT, family=FONT), bordercolor=GRID),
    )
    fig.update_xaxes(gridcolor=GRID, linecolor=GRID, zerolinecolor=GRID)
    fig.update_yaxes(gridcolor=GRID, linecolor=GRID, zerolinecolor=GRID)


def fetch_csv(url, **kwargs):
    import io
    import pandas as pd
    import requests
    r = requests.get(url, timeout=60)
    r.raise_for_status()
    return pd.read_csv(io.StringIO(r.text), **kwargs)


def fetch_json(url):
    import requests
    r = requests.get(url, timeout=60)
    r.raise_for_status()
    return r.json()

import io
import pandas as pd
import plotly.graph_objects as go
import requests, warnings

URL = "https://raw.githubusercontent.com/plotly/datasets/master/state-population-projections-by-race-sex-age-groups.csv"


def generate():
    print("fetching CA population pyramid data (;-delimited, UTF-8 BOM) …")
    warnings.filterwarnings("ignore")
    requests.packages.urllib3.disable_warnings()
    r = requests.get(URL, verify=False, timeout=30)
    r.raise_for_status()
    text = r.content.decode("utf-8-sig")   # strip BOM
    df = pd.read_csv(io.StringIO(text), sep=None, engine="python")
    df.columns = [c.strip() for c in df.columns]
    print(f"  cols: {list(df.columns)}, rows: {len(df)}")

    # Filter to California and pick most recent year
    state_col = next((c for c in df.columns if "state" in c.lower()), None)
    year_col  = next((c for c in df.columns if c.lower() == "year"), None)
    sex_col   = next((c for c in df.columns if c.lower() == "sex"), None)

    # Wide-format dataset: age group columns start with "Age "
    # Only use the detailed single-age-band columns (before the 'Total' column),
    # not the broad summary bands like 'Age 0 to 17', 'Age 65 Plus'.
    col_list = list(df.columns)
    total_idx = next((i for i, c in enumerate(col_list) if c.lower() == "total"), len(col_list))
    age_cols = [c for c in col_list[:total_idx] if c.lower().startswith("age ")]
    print(f"  state={state_col}, year={year_col}, sex={sex_col}, age_cols={len(age_cols)}")

    if not all([sex_col, age_cols]):
        raise ValueError(f"Could not identify required columns. Available: {list(df.columns)}")

    # Filter California
    if state_col:
        ca_vals = ["California", "CA", "6"]
        df_ca = df[df[state_col].astype(str).isin(ca_vals)]
        if len(df_ca) == 0:
            df_ca = df
    else:
        df_ca = df

    # Most recent real year (not projection), or just max
    if year_col:
        est_col = next((c for c in df_ca.columns if "estimate" in c.lower()), None)
        if est_col:
            df_est = df_ca[df_ca[est_col].astype(str).str.lower().str.contains("estimate", na=False)]
            df_use = df_est if len(df_est) > 0 else df_ca
        else:
            df_use = df_ca
        latest = df_use[year_col].max()
        df_ca = df_use[df_use[year_col] == latest]
        print(f"  using year: {latest}")

    # Numeric conversion of age columns
    for c in age_cols:
        df_ca[c] = pd.to_numeric(df_ca[c], errors="coerce").fillna(0)

    # Melt to long format: Sex, Age, Population
    id_vars = [sex_col]
    df_long = df_ca.melt(id_vars=id_vars, value_vars=age_cols, var_name="Age", value_name="Population")
    agg = df_long.groupby(["Age", sex_col])["Population"].sum().reset_index()
    print(f"  sex values: {agg[sex_col].unique()}")

    # Identify male/female values
    male_val   = next((v for v in agg[sex_col].unique() if str(v).lower() in ("male","m","1")), agg[sex_col].unique()[0])
    female_val = next((v for v in agg[sex_col].unique() if str(v).lower() in ("female","f","2")), agg[sex_col].unique()[-1])

    male_df   = agg[agg[sex_col] == male_val].set_index("Age")["Population"]
    female_df = agg[agg[sex_col] == female_val].set_index("Age")["Population"]

    # Sort by age group order (preserve original column order)
    ages = [c for c in age_cols if c in male_df.index and c in female_df.index]
    # Shorten labels: "Age 0 to 2" → "0-2"
    age_labels = [a.replace("Age ", "").replace(" to ", "-").replace(" ", "") for a in ages]

    m_vals = [-male_df.get(a, 0) / 1000 for a in ages]    # negated for left side, in thousands
    f_vals = [ female_df.get(a, 0) / 1000 for a in ages]

    fig = go.Figure()
    fig.add_trace(go.Bar(
        x=m_vals, y=age_labels,
        orientation="h", name="Male",
        marker=dict(color=VIOLET, opacity=0.85),
        hovertemplate="Male %{y}: %{customdata:,.0f}<extra></extra>",
        customdata=[-v * 1000 for v in m_vals],
    ))
    fig.add_trace(go.Bar(
        x=f_vals, y=age_labels,
        orientation="h", name="Female",
        marker=dict(color=PINK, opacity=0.85),
        hovertemplate="Female %{y}: %{customdata:,.0f}<extra></extra>",
        customdata=[v * 1000 for v in f_vals],
    ))

    fig.update_layout(
        title=dict(text="California Population Pyramid", x=0.5),
        barmode="overlay",
        xaxis=dict(
            title="Population (thousands)",
            tickformat=".0f",
            tickvals=[-max(abs(v) for v in m_vals)*0.8, -max(abs(v) for v in m_vals)*0.4,
                      0, max(f_vals)*0.4, max(f_vals)*0.8],
            ticktext=[f"{abs(v):.0f}" for v in [-max(abs(v) for v in m_vals)*0.8,
                      -max(abs(v) for v in m_vals)*0.4, 0, max(f_vals)*0.4, max(f_vals)*0.8]],
        ),
        yaxis=dict(title="Age Group"),
        legend=dict(orientation="h", y=1.08),
        bargap=0.05,
        margin=dict(t=60, b=50, l=100, r=40),
        height=520,
    )
    apply_theme(fig)
    return fig


fig = generate()
fig.show()
Made with Plotly