
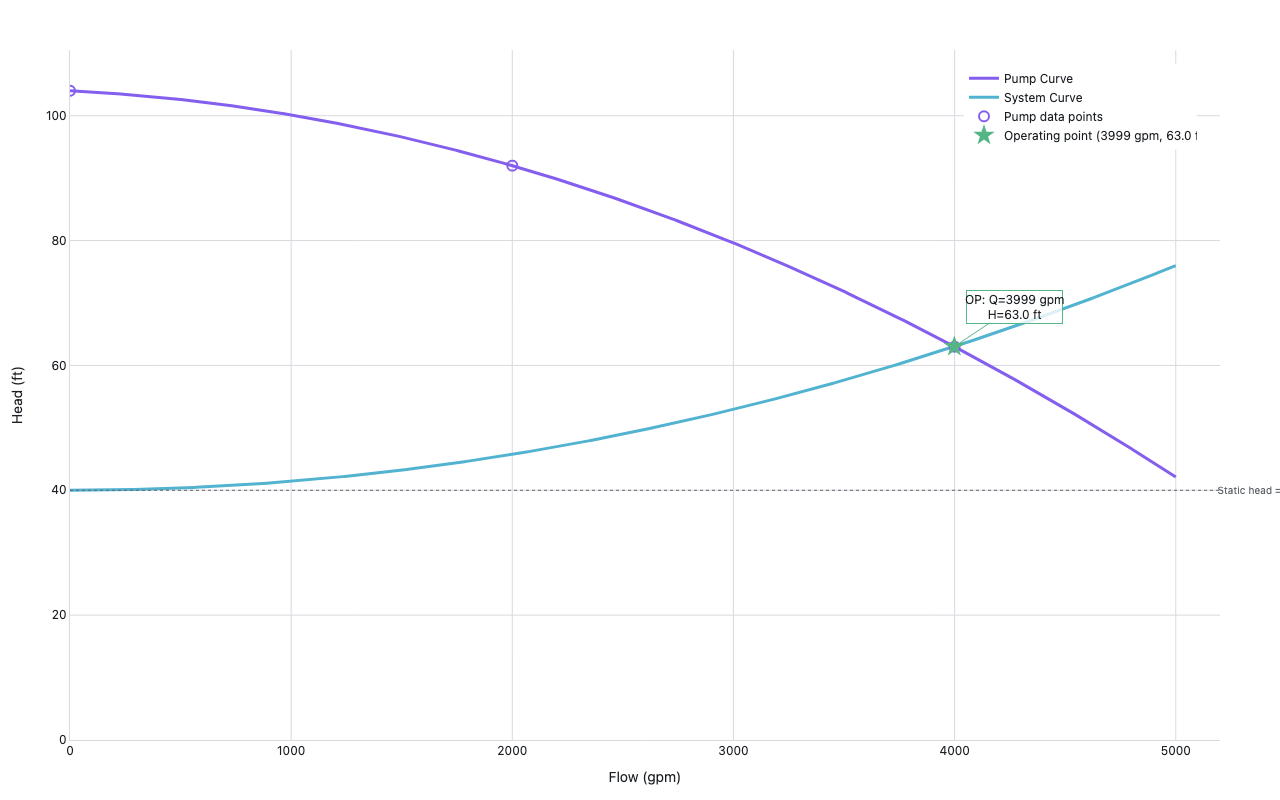
Pump & System Curve
Process Engineering — EPANET Net3 pump
Example from the compendium of canonical charts
Python Code
"""Process Engineering — Pump & System Curve (EPANET Net3 pump)."""
from pathlib import Path

# ── Palette + theme (matching the Plotly Studio gallery these charts ship in) ──
VIOLET, TEAL, GREEN, PINK, ORANGE = "#845EEE", "#52B3D0", "#55B685", "#DA5597", "#E9A23B"
PRIMARY, SECONDARY = VIOLET, TEAL
COLORWAY = [VIOLET, TEAL, GREEN, PINK, ORANGE]
BG, TEXT, GRID, MUTED = "#ffffff", "#1c2024", "#d9d9e0", "#60646c"
FONT = "Inter, -apple-system, BlinkMacSystemFont, sans-serif"
COLORSCALE = [[0, "rgba(132, 94, 238, 0.05)"], [1, "rgba(132, 94, 238, 0.9)"]]


def apply_theme(fig):
    """Light gallery theme: white background, Inter font, soft gridlines."""
    fig.update_layout(
        paper_bgcolor=BG, plot_bgcolor=BG, colorway=COLORWAY,
        font=dict(family=FONT, color=TEXT, size=12),
        legend=dict(font=dict(color=TEXT)),
        hoverlabel=dict(bgcolor="#f0f0f3", font=dict(color=TEXT, family=FONT), bordercolor=GRID),
    )
    fig.update_xaxes(gridcolor=GRID, linecolor=GRID, zerolinecolor=GRID)
    fig.update_yaxes(gridcolor=GRID, linecolor=GRID, zerolinecolor=GRID)


def fetch_csv(url, **kwargs):
    import io
    import pandas as pd
    import requests
    r = requests.get(url, timeout=60)
    r.raise_for_status()
    return pd.read_csv(io.StringIO(r.text), **kwargs)


def fetch_json(url):
    import requests
    r = requests.get(url, timeout=60)
    r.raise_for_status()
    return r.json()

import re
import numpy as np
import requests
import plotly.graph_objects as go


# Known pump curve from EPANET Net3 spec
NET3_PUMP_Q = [0, 2000, 4000]   # gpm
NET3_PUMP_H = [104, 92, 63]     # ft


def _fetch_net3_curves():
    """Attempt to parse [CURVES] from EPANET Net3.inp."""
    url = "https://raw.githubusercontent.com/OpenWaterAnalytics/EPANET/dev/example-networks/Net3.inp"
    r = requests.get(url, verify=False, timeout=60)
    r.raise_for_status()
    text = r.text

    # Parse [CURVES] section
    in_curves = False
    curves = {}
    for line in text.splitlines():
        stripped = line.strip()
        if stripped.upper().startswith("[CURVES]"):
            in_curves = True
            continue
        if in_curves and stripped.startswith("["):
            break
        if in_curves and stripped and not stripped.startswith(";"):
            parts = stripped.split()
            if len(parts) >= 3:
                cid = parts[0]
                try:
                    q_val = float(parts[1])
                    h_val = float(parts[2])
                    curves.setdefault(cid, {"Q": [], "H": []})
                    curves[cid]["Q"].append(q_val)
                    curves[cid]["H"].append(h_val)
                except ValueError:
                    pass

    # Find pump curve(s) — look for curve with head decreasing as Q increases
    for cid, data in curves.items():
        Q = np.array(data["Q"])
        H = np.array(data["H"])
        if len(Q) >= 2 and H[0] > H[-1]:
            print(f"  found pump curve ID={cid}: Q={list(Q)}, H={list(H)}")
            return Q, H
    return None, None


def generate():
    Q_pump_pts = None
    H_pump_pts = None

    try:
        Q_pump_pts, H_pump_pts = _fetch_net3_curves()
        if Q_pump_pts is None:
            raise ValueError("no pump curve found in parsed data")
        print(f"  using fetched Net3 pump curve: Q={Q_pump_pts}, H={H_pump_pts}")
    except Exception as e:
        print(f"  Net3 fetch/parse failed ({e}), using spec data")
        Q_pump_pts = np.array(NET3_PUMP_Q, dtype=float)
        H_pump_pts = np.array(NET3_PUMP_H, dtype=float)

    # Fit quadratic to pump curve: H = a + b*Q + c*Q²
    coeffs = np.polyfit(Q_pump_pts, H_pump_pts, 2)
    print(f"  pump curve coeffs (quadratic): {coeffs}")

    Q = np.linspace(0, 5000, 500)
    H_pump = np.polyval(coeffs, Q)
    H_pump = np.clip(H_pump, 0, None)

    # System curve: H_sys = H_static + k*Q²
    H_static = 40.0        # ft static head
    k_sys = 1.44e-6        # ft/(gpm)²
    H_sys = H_static + k_sys * Q ** 2

    # Operating point — find intersection
    diff = H_pump - H_sys
    # Find sign change
    sign_change = np.where(np.diff(np.sign(diff)))[0]
    if len(sign_change) > 0:
        idx = sign_change[0]
        # Linear interpolation between idx and idx+1
        Q_op = Q[idx] + (Q[idx + 1] - Q[idx]) * (-diff[idx] / (diff[idx + 1] - diff[idx]))
        H_op = np.polyval(coeffs, Q_op)
        H_op = max(H_op, 0)
    else:
        Q_op = Q_pump_pts[-1]
        H_op = float(np.polyval(coeffs, Q_op))

    print(f"  operating point: Q={Q_op:.0f} gpm, H={H_op:.1f} ft")

    fig = go.Figure()

    # Pump curve
    fig.add_trace(go.Scatter(
        x=Q,
        y=H_pump,
        mode="lines",
        line=dict(color=VIOLET, width=3),
        name="Pump Curve",
        hovertemplate="Q=%{x:.0f} gpm<br>H=%{y:.1f} ft<extra></extra>",
    ))

    # System curve
    fig.add_trace(go.Scatter(
        x=Q,
        y=H_sys,
        mode="lines",
        line=dict(color=TEAL, width=3),
        name="System Curve",
        hovertemplate="Q=%{x:.0f} gpm<br>H=%{y:.1f} ft<extra></extra>",
    ))

    # Data points used for pump curve fit
    fig.add_trace(go.Scatter(
        x=Q_pump_pts,
        y=H_pump_pts,
        mode="markers",
        marker=dict(size=10, color=VIOLET, symbol="circle-open", line=dict(width=2)),
        name="Pump data points",
        hovertemplate="Q=%{x:.0f} gpm<br>H=%{y:.1f} ft<extra></extra>",
    ))

    # Operating point
    fig.add_trace(go.Scatter(
        x=[Q_op],
        y=[H_op],
        mode="markers",
        marker=dict(size=16, color=GREEN, symbol="star"),
        name=f"Operating point ({Q_op:.0f} gpm, {H_op:.1f} ft)",
        hovertemplate=f"Operating Point<br>Q={Q_op:.0f} gpm<br>H={H_op:.1f} ft<extra></extra>",
    ))

    # Annotation for operating point
    fig.add_annotation(
        x=Q_op,
        y=H_op,
        text=f"OP: Q={Q_op:.0f} gpm<br>H={H_op:.1f} ft",
        showarrow=True,
        arrowhead=2,
        arrowcolor=GREEN,
        font=dict(size=12, color=TEXT),
        ax=60,
        ay=-40,
        bgcolor="rgba(255,255,255,0.8)",
        bordercolor=GREEN,
        borderwidth=1,
    )

    # Static head reference line
    fig.add_hline(
        y=H_static,
        line=dict(color=MUTED, width=1, dash="dot"),
        annotation_text=f"Static head = {H_static:.0f} ft",
        annotation_position="right",
        annotation_font=dict(size=10, color=MUTED),
    )

    fig.update_layout(
        xaxis=dict(title="Flow (gpm)", rangemode="tozero", range=[0, 5200]),
        yaxis=dict(title="Head (ft)", rangemode="tozero"),
        legend=dict(x=0.98, y=0.98, xanchor="right", yanchor="top"),
        margin=dict(t=50, b=60, l=70, r=60),
    )

    apply_theme(fig)
    return fig


fig = generate()
fig.show()
Made with Plotly