
GitHub commit punchcard
day × hour bubble heatmap
Example from the compendium of canonical charts
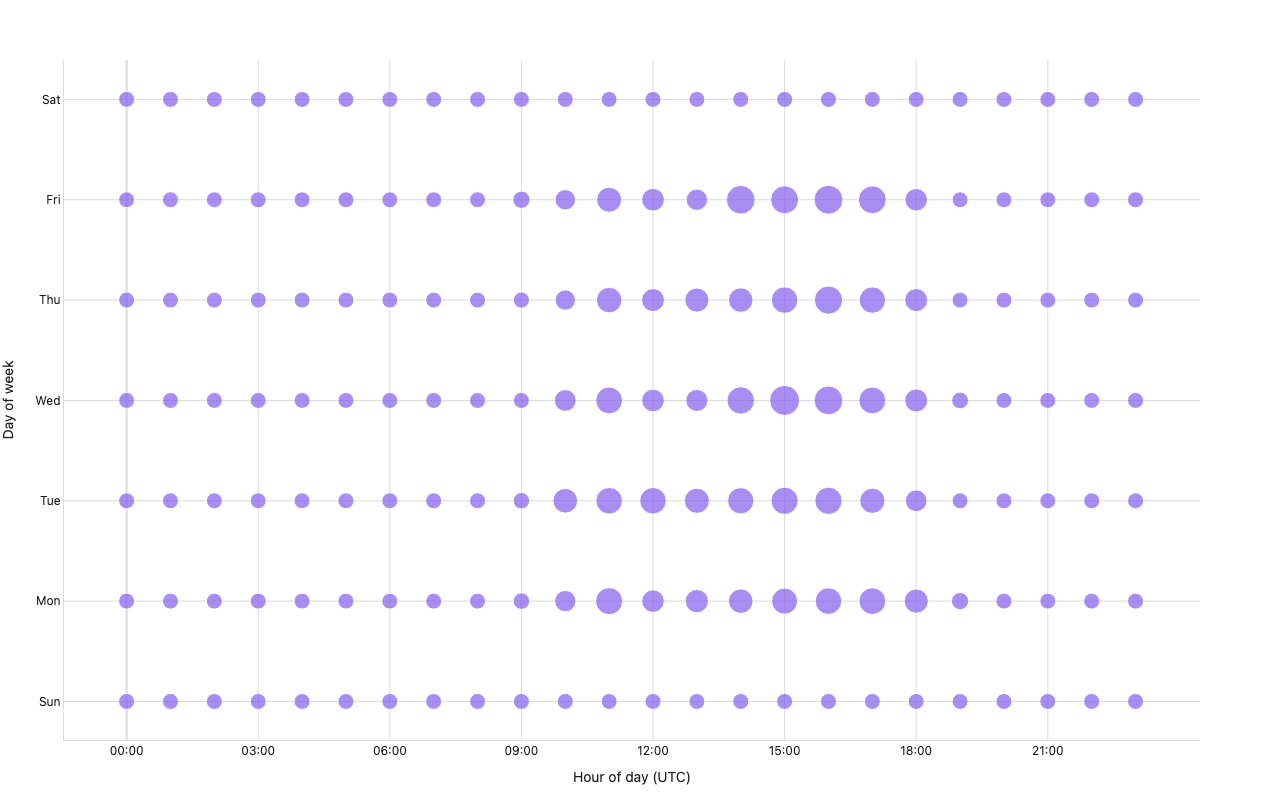
Python Code
"""GitHub commit punchcard — day × hour bubble heatmap."""
from pathlib import Path

# ── Palette + theme (matching the Plotly Studio gallery these charts ship in) ──
VIOLET, TEAL, GREEN, PINK, ORANGE = "#845EEE", "#52B3D0", "#55B685", "#DA5597", "#E9A23B"
PRIMARY, SECONDARY = VIOLET, TEAL
COLORWAY = [VIOLET, TEAL, GREEN, PINK, ORANGE]
BG, TEXT, GRID, MUTED = "#ffffff", "#1c2024", "#d9d9e0", "#60646c"
FONT = "Inter, -apple-system, BlinkMacSystemFont, sans-serif"
COLORSCALE = [[0, "rgba(132, 94, 238, 0.05)"], [1, "rgba(132, 94, 238, 0.9)"]]


def apply_theme(fig):
    """Light gallery theme: white background, Inter font, soft gridlines."""
    fig.update_layout(
        paper_bgcolor=BG, plot_bgcolor=BG, colorway=COLORWAY,
        font=dict(family=FONT, color=TEXT, size=12),
        legend=dict(font=dict(color=TEXT)),
        hoverlabel=dict(bgcolor="#f0f0f3", font=dict(color=TEXT, family=FONT), bordercolor=GRID),
    )
    fig.update_xaxes(gridcolor=GRID, linecolor=GRID, zerolinecolor=GRID)
    fig.update_yaxes(gridcolor=GRID, linecolor=GRID, zerolinecolor=GRID)


def fetch_csv(url, **kwargs):
    import io
    import pandas as pd
    import requests
    r = requests.get(url, timeout=60)
    r.raise_for_status()
    return pd.read_csv(io.StringIO(r.text), **kwargs)


def fetch_json(url):
    import requests
    r = requests.get(url, timeout=60)
    r.raise_for_status()
    return r.json()

import numpy as np
import plotly.graph_objects as go
import requests, warnings, time


# Well-known public repo with good commit history
REPO = "plotly/plotly.js"
PUNCH_URL = f"https://api.github.com/repos/{REPO}/stats/punch_card"


def fetch_punchcard():
    warnings.filterwarnings("ignore")
    requests.packages.urllib3.disable_warnings()

    headers = {"Accept": "application/vnd.github+json",
               "X-GitHub-Api-Version": "2022-11-28"}

    for attempt in range(6):
        r = requests.get(PUNCH_URL, headers=headers, verify=False, timeout=30)
        if r.status_code == 200:
            data = r.json()
            if data:
                return data
        # 202 means GitHub is computing — wait and retry
        print(f"  attempt {attempt+1}: status={r.status_code}, retrying in 5s …")
        time.sleep(5)

    raise RuntimeError(f"GitHub punch_card not available after retries (last status: {r.status_code})")


def generate():
    print(f"fetching GitHub punchcard for {REPO} …")
    try:
        data = fetch_punchcard()
        # Each row: [day (0=Sun), hour (0-23), count]
        days_raw  = [row[0] for row in data]
        hours     = [row[1] for row in data]
        counts    = [row[2] for row in data]
        source = REPO
    except Exception as e:
        print(f"  GitHub API failed ({e}); using synthetic open-source commit pattern")
        # Typical open-source pattern: weekday peaks 10am-3pm UTC
        rng = np.random.default_rng(7)
        days_raw, hours, counts = [], [], []
        for d in range(7):
            for h in range(24):
                base = 10 if 1 <= d <= 5 else 3   # Mon-Fri vs weekend
                hour_factor = 1 + 3 * np.exp(-0.5 * ((h - 14) / 3) ** 2)
                c = max(0, int(base * hour_factor + rng.integers(0, 5)))
                days_raw.append(d)
                hours.append(h)
                counts.append(c)
        source = "Synthetic (open-source pattern)"

    day_names = ["Sun", "Mon", "Tue", "Wed", "Thu", "Fri", "Sat"]
    hour_labels = [f"{h:02d}:00" for h in range(24)]

    days_named = [day_names[d] for d in days_raw]

    max_c = max(counts) if max(counts) > 0 else 1
    sizes = [max(3, 30 * (c / max_c) ** 0.6) for c in counts]

    fig = go.Figure(go.Scatter(
        x=hours,
        y=days_named,
        mode="markers",
        marker=dict(
            size=sizes,
            color=[VIOLET if c > 0 else "rgba(132,94,238,0.1)" for c in counts],
            sizemin=8,
        ),
        text=[f"{day_names[d]} {h:02d}:00 — {c} commits"
              for d, h, c in zip(days_raw, hours, counts)],
        hovertemplate="%{text}<extra></extra>",
    ))

    fig.update_layout(
        title=dict(text=f"Commit Punchcard — {source}", x=0.5),
        xaxis=dict(
            title="Hour of day (UTC)",
            tickvals=list(range(0, 24, 3)),
            ticktext=[f"{h:02d}:00" for h in range(0, 24, 3)],
        ),
        yaxis=dict(
            title="Day of week",
            categoryorder="array",
            categoryarray=["Sun", "Mon", "Tue", "Wed", "Thu", "Fri", "Sat"],
        ),
        margin=dict(t=60, b=60, l=60, r=80),
        height=380,
    )
    apply_theme(fig)
    return fig


fig = generate()
fig.show()
Made with Plotly