
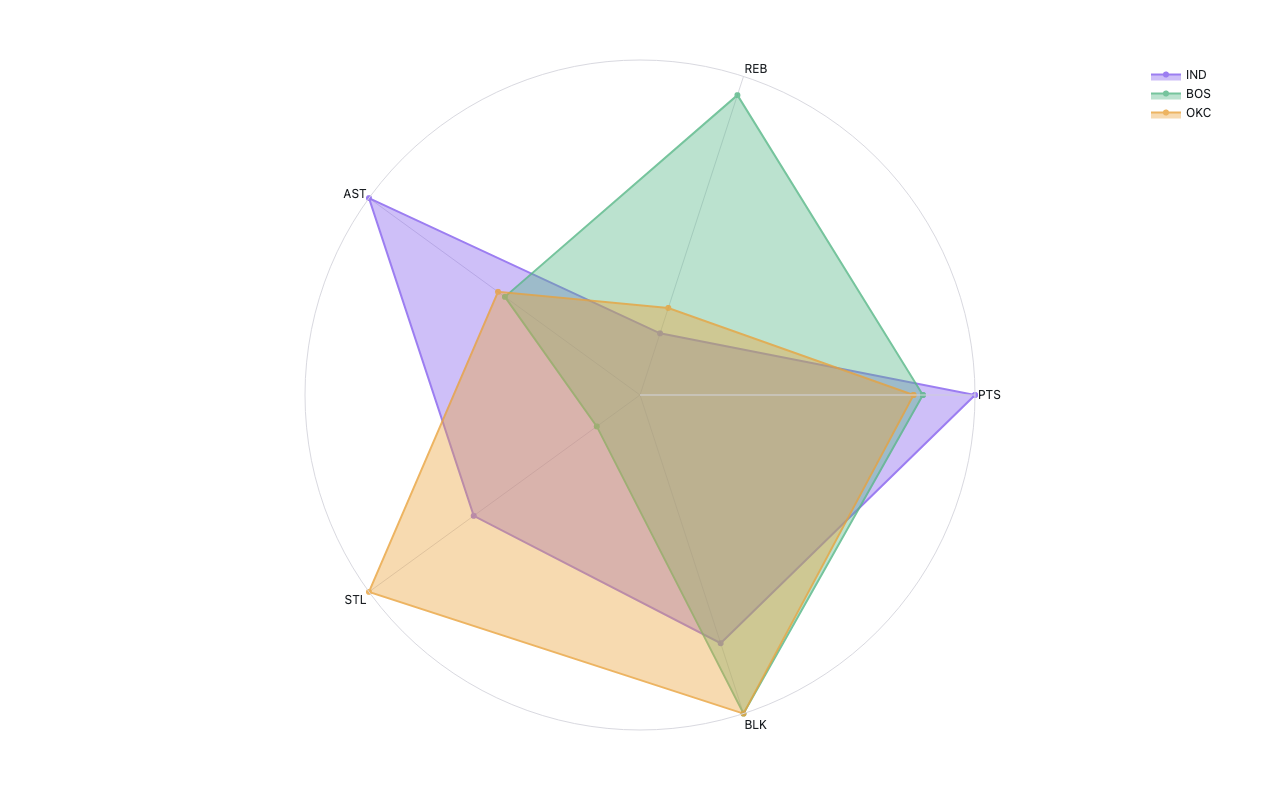
Radar/spider chart
NBA team averages, top 3 teams by scoring, 2023-24 season
Example from the compendium of canonical charts
Python Code
"""Radar/spider chart — NBA team averages, top 3 teams by scoring, 2023-24 season."""
from pathlib import Path

# ── Palette + theme (matching the Plotly Studio gallery these charts ship in) ──
VIOLET, TEAL, GREEN, PINK, ORANGE = "#845EEE", "#52B3D0", "#55B685", "#DA5597", "#E9A23B"
PRIMARY, SECONDARY = VIOLET, TEAL
COLORWAY = [VIOLET, TEAL, GREEN, PINK, ORANGE]
BG, TEXT, GRID, MUTED = "#ffffff", "#1c2024", "#d9d9e0", "#60646c"
FONT = "Inter, -apple-system, BlinkMacSystemFont, sans-serif"
COLORSCALE = [[0, "rgba(132, 94, 238, 0.05)"], [1, "rgba(132, 94, 238, 0.9)"]]


def apply_theme(fig):
    """Light gallery theme: white background, Inter font, soft gridlines."""
    fig.update_layout(
        paper_bgcolor=BG, plot_bgcolor=BG, colorway=COLORWAY,
        font=dict(family=FONT, color=TEXT, size=12),
        legend=dict(font=dict(color=TEXT)),
        hoverlabel=dict(bgcolor="#f0f0f3", font=dict(color=TEXT, family=FONT), bordercolor=GRID),
    )
    fig.update_xaxes(gridcolor=GRID, linecolor=GRID, zerolinecolor=GRID)
    fig.update_yaxes(gridcolor=GRID, linecolor=GRID, zerolinecolor=GRID)


def fetch_csv(url, **kwargs):
    import io
    import pandas as pd
    import requests
    r = requests.get(url, timeout=60)
    r.raise_for_status()
    return pd.read_csv(io.StringIO(r.text), **kwargs)


def fetch_json(url):
    import requests
    r = requests.get(url, timeout=60)
    r.raise_for_status()
    return r.json()

import plotly.graph_objects as go

URL = "https://raw.githubusercontent.com/NocturneBear/NBA-Data-2010-2024/main/regular_season_totals_2010_2024.csv"

STATS = ["PTS", "REB", "AST", "STL", "BLK"]
COLORS = COLORWAY[:3]


def generate():
    print("fetching NBA regular season totals …")
    df = fetch_csv(URL)
    df.columns = [c.strip() for c in df.columns]
    print(f"  columns: {list(df.columns)}")

    season_col = next((c for c in df.columns if c.upper() in ("SEASON_YEAR", "SEASON", "YEAR")), None)
    team_col   = next((c for c in df.columns if c.upper() in ("TEAM_NAME", "TEAM", "TM", "FRANCHISE", "TEAM_ABBREVIATION")), None)

    if season_col is None or team_col is None:
        raise ValueError(f"Could not find season/team columns. Cols: {list(df.columns)}")

    seasons = sorted(df[season_col].unique())
    latest  = seasons[-1]
    print(f"  using season: {latest}")
    season_df = df[df[season_col] == latest]

    avail_stats = [s for s in STATS if s in season_df.columns]
    if not avail_stats:
        raise ValueError(f"None of {STATS} found. Cols: {list(season_df.columns)}")

    agg = season_df.groupby(team_col)[avail_stats].mean().reset_index()

    sort_by = "PTS" if "PTS" in agg.columns else avail_stats[0]
    top3 = agg.nlargest(3, sort_by)[team_col].tolist()

    # Normalize each stat 0–1 across all teams so axes are visually comparable
    normed = agg.copy()
    for stat in avail_stats:
        mn, mx = agg[stat].min(), agg[stat].max()
        normed[stat] = (agg[stat] - mn) / (mx - mn) if mx > mn else 0.5

    traces = []
    for team, color in zip(top3, COLORS):
        row     = normed[normed[team_col] == team].iloc[0]
        raw_row = agg[agg[team_col] == team].iloc[0]

        r_vals    = [row[s] for s in avail_stats] + [row[avail_stats[0]]]
        theta     = avail_stats + [avail_stats[0]]
        hover_raw = [f"{raw_row[s]:.1f}" for s in avail_stats] + [f"{raw_row[avail_stats[0]]:.1f}"]

        traces.append(go.Scatterpolar(
            r=r_vals,
            theta=theta,
            fill="toself",
            name=team,
            line=dict(color=color),
            opacity=0.8,
            customdata=hover_raw,
            hovertemplate="<b>" + team + "</b><br>%{theta}: %{customdata}<extra></extra>",
        ))

    fig = go.Figure(traces)
    fig.update_layout(
        title=dict(text=f"NBA Team Radar — {latest}, top 3 scorers (normalized)", x=0.5),
        polar=dict(radialaxis=dict(visible=True, range=[0, 1], tickvals=[])),
        legend=dict(orientation="v", x=0.98, xanchor="right", y=1, yanchor="top"),
        margin=dict(t=60, b=70, l=40, r=40),
        height=500,
    )
    apply_theme(fig)
    return fig


fig = generate()
fig.show()
Made with Plotly