
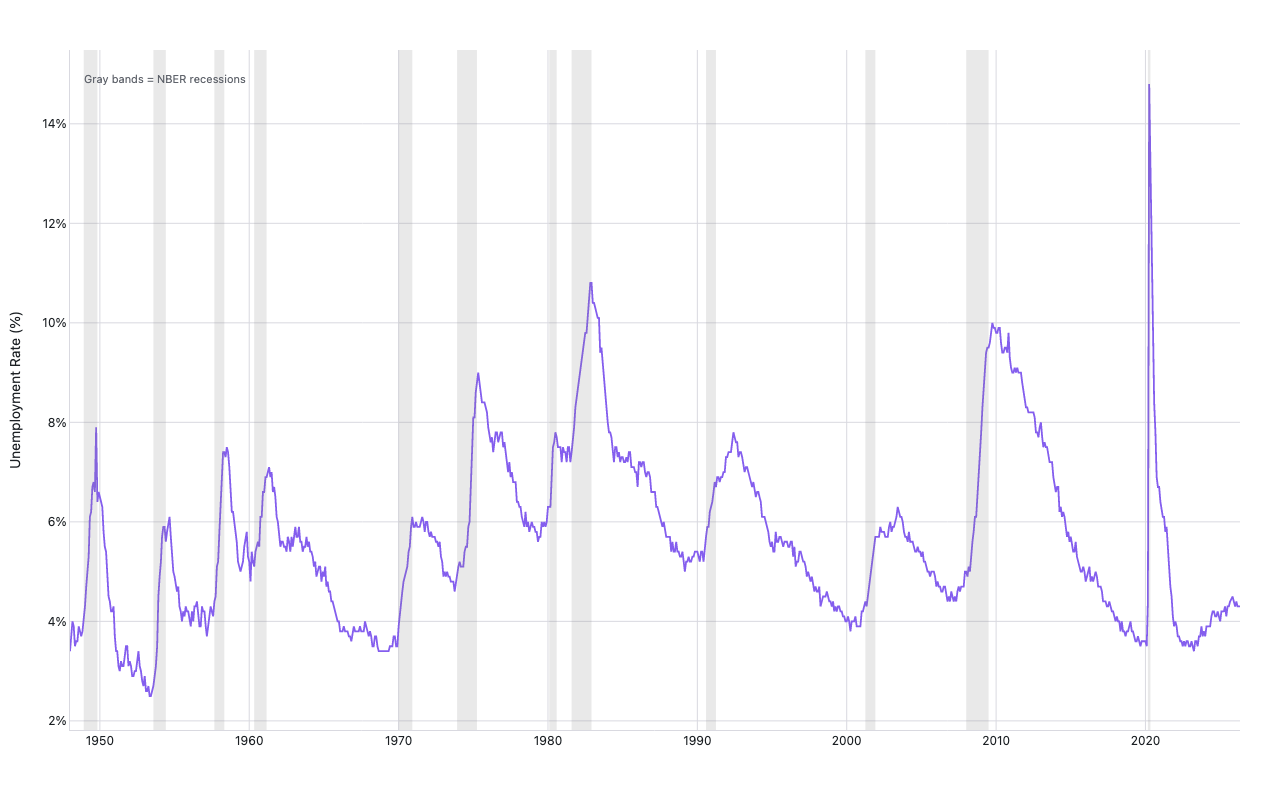
Unemployment rate with NBER recession shading
Macroeconomics
Example from the compendium of canonical charts
Python Code
"""Macroeconomics — Unemployment rate with NBER recession shading."""
from pathlib import Path

# ── Palette + theme (matching the Plotly Studio gallery these charts ship in) ──
VIOLET, TEAL, GREEN, PINK, ORANGE = "#845EEE", "#52B3D0", "#55B685", "#DA5597", "#E9A23B"
PRIMARY, SECONDARY = VIOLET, TEAL
COLORWAY = [VIOLET, TEAL, GREEN, PINK, ORANGE]
BG, TEXT, GRID, MUTED = "#ffffff", "#1c2024", "#d9d9e0", "#60646c"
FONT = "Inter, -apple-system, BlinkMacSystemFont, sans-serif"
COLORSCALE = [[0, "rgba(132, 94, 238, 0.05)"], [1, "rgba(132, 94, 238, 0.9)"]]


def apply_theme(fig):
    """Light gallery theme: white background, Inter font, soft gridlines."""
    fig.update_layout(
        paper_bgcolor=BG, plot_bgcolor=BG, colorway=COLORWAY,
        font=dict(family=FONT, color=TEXT, size=12),
        legend=dict(font=dict(color=TEXT)),
        hoverlabel=dict(bgcolor="#f0f0f3", font=dict(color=TEXT, family=FONT), bordercolor=GRID),
    )
    fig.update_xaxes(gridcolor=GRID, linecolor=GRID, zerolinecolor=GRID)
    fig.update_yaxes(gridcolor=GRID, linecolor=GRID, zerolinecolor=GRID)


def fetch_csv(url, **kwargs):
    import io
    import pandas as pd
    import requests
    r = requests.get(url, timeout=60)
    r.raise_for_status()
    return pd.read_csv(io.StringIO(r.text), **kwargs)


def fetch_json(url):
    import requests
    r = requests.get(url, timeout=60)
    r.raise_for_status()
    return r.json()

import pandas as pd
import plotly.graph_objects as go

UNRATE_URL = "https://fred.stlouisfed.org/graph/fredgraph.csv?id=UNRATE"
USREC_URL  = "https://fred.stlouisfed.org/graph/fredgraph.csv?id=USREC"


def generate():
    print("fetching UNRATE and USREC from FRED …")
    unrate = fetch_csv(UNRATE_URL)
    usrec  = fetch_csv(USREC_URL)

    unrate.columns = ["date", "unrate"]
    usrec.columns  = ["date", "rec"]
    unrate["date"] = pd.to_datetime(unrate["date"], errors="coerce")
    usrec["date"]  = pd.to_datetime(usrec["date"],  errors="coerce")

    # Align on common date range
    df = pd.merge(unrate, usrec, on="date", how="inner").sort_values("date")
    df = df.dropna()

    # Find contiguous recession blocks
    in_rec = False
    rec_start = None
    rec_blocks = []
    for _, row in df.iterrows():
        if row["rec"] == 1 and not in_rec:
            in_rec = True
            rec_start = row["date"]
        elif row["rec"] == 0 and in_rec:
            in_rec = False
            rec_blocks.append((rec_start, row["date"]))
    if in_rec:
        rec_blocks.append((rec_start, df["date"].iloc[-1]))

    fig = go.Figure()

    # Recession vrects (add first so they sit behind the line)
    for start, end in rec_blocks:
        fig.add_vrect(
            x0=start, x1=end,
            fillcolor="gray", opacity=0.18,
            line_width=0,
        )

    # UNRATE line
    fig.add_trace(go.Scatter(
        x=df["date"],
        y=df["unrate"],
        mode="lines",
        line=dict(color=VIOLET, width=1.8),
        name="Unemployment Rate",
        hovertemplate="%{x|%b %Y}: %{y:.1f}%<extra></extra>",
    ))

    fig.update_layout(
        xaxis=dict(title=""),
        yaxis=dict(title="Unemployment Rate (%)", ticksuffix="%"),
        legend=dict(orientation="h", y=-0.14),
        margin=dict(t=50, b=70, l=70, r=40),
        annotations=[dict(
            x=0.01, y=0.97,
            xref="paper", yref="paper",
            text="Gray bands = NBER recessions",
            showarrow=False,
            font=dict(size=11, color="#60646c"),
            align="left",
        )],
    )
    apply_theme(fig)
    return fig


fig = generate()
fig.show()
Made with Plotly