
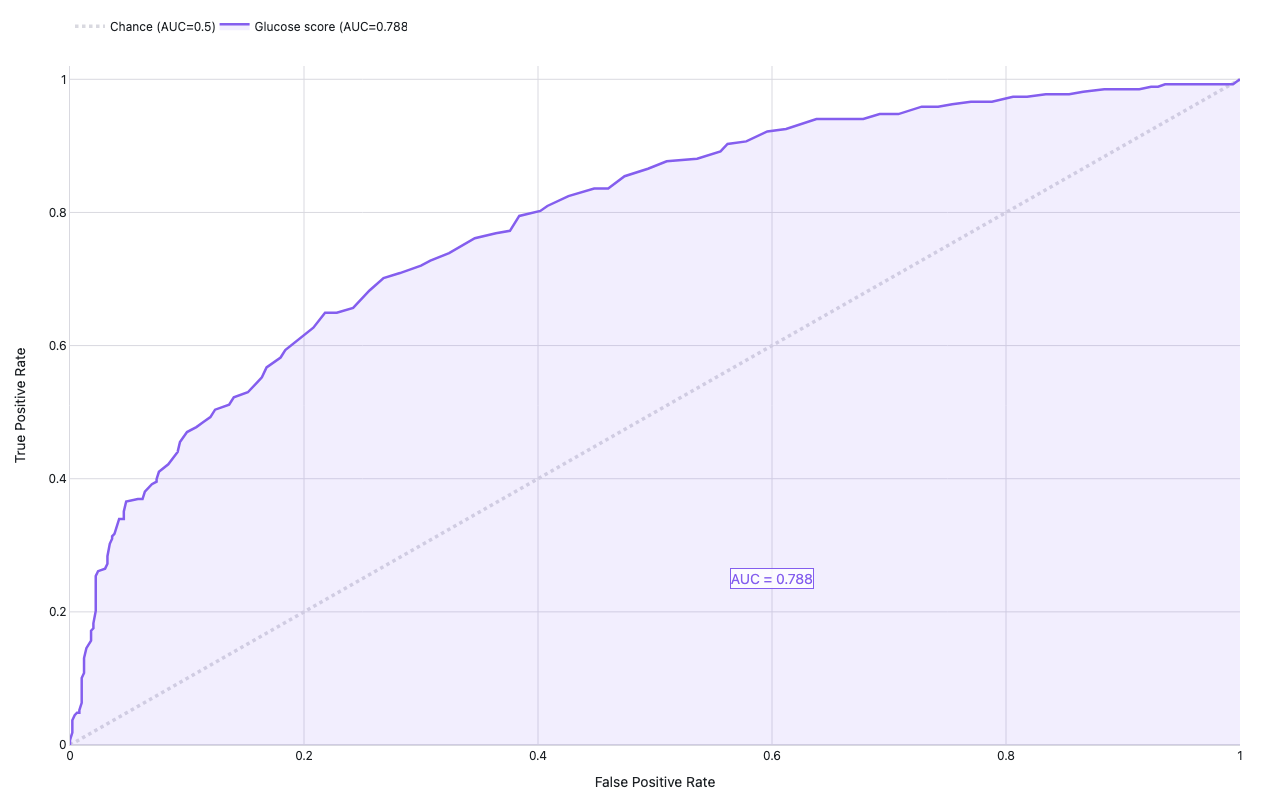
ROC curve
Pima diabetes, Glucose as score
Example from the compendium of canonical charts
Python Code
"""ROC curve — Pima diabetes, Glucose as score."""
from pathlib import Path

# ── Palette + theme (matching the Plotly Studio gallery these charts ship in) ──
VIOLET, TEAL, GREEN, PINK, ORANGE = "#845EEE", "#52B3D0", "#55B685", "#DA5597", "#E9A23B"
PRIMARY, SECONDARY = VIOLET, TEAL
COLORWAY = [VIOLET, TEAL, GREEN, PINK, ORANGE]
BG, TEXT, GRID, MUTED = "#ffffff", "#1c2024", "#d9d9e0", "#60646c"
FONT = "Inter, -apple-system, BlinkMacSystemFont, sans-serif"
COLORSCALE = [[0, "rgba(132, 94, 238, 0.05)"], [1, "rgba(132, 94, 238, 0.9)"]]


def apply_theme(fig):
    """Light gallery theme: white background, Inter font, soft gridlines."""
    fig.update_layout(
        paper_bgcolor=BG, plot_bgcolor=BG, colorway=COLORWAY,
        font=dict(family=FONT, color=TEXT, size=12),
        legend=dict(font=dict(color=TEXT)),
        hoverlabel=dict(bgcolor="#f0f0f3", font=dict(color=TEXT, family=FONT), bordercolor=GRID),
    )
    fig.update_xaxes(gridcolor=GRID, linecolor=GRID, zerolinecolor=GRID)
    fig.update_yaxes(gridcolor=GRID, linecolor=GRID, zerolinecolor=GRID)


def fetch_csv(url, **kwargs):
    import io
    import pandas as pd
    import requests
    r = requests.get(url, timeout=60)
    r.raise_for_status()
    return pd.read_csv(io.StringIO(r.text), **kwargs)


def fetch_json(url):
    import requests
    r = requests.get(url, timeout=60)
    r.raise_for_status()
    return r.json()

import numpy as np
import pandas as pd
import plotly.graph_objects as go

URL = "https://raw.githubusercontent.com/plotly/datasets/master/diabetes.csv"


def compute_roc(scores, labels):
    """Manual ROC computation: returns (fpr, tpr, auc)."""
    thresholds = np.sort(np.unique(scores))[::-1]
    tp_total = labels.sum()
    fp_total = (~labels).sum()

    fprs, tprs = [0.0], [0.0]
    for thresh in thresholds:
        pred = scores >= thresh
        tp = (pred & labels).sum()
        fp = (pred & ~labels).sum()
        fprs.append(fp / fp_total if fp_total > 0 else 0)
        tprs.append(tp / tp_total if tp_total > 0 else 0)
    fprs.append(1.0); tprs.append(1.0)

    auc = np.trapz(tprs, fprs)
    return np.array(fprs), np.array(tprs), auc


def generate():
    print("fetching Pima diabetes dataset …")
    df = fetch_csv(URL)
    df.columns = [c.strip() for c in df.columns]
    print(f"  cols: {list(df.columns)}, rows: {len(df)}")

    score_col   = next((c for c in df.columns if "glucose" in c.lower()), df.columns[1])
    outcome_col = next((c for c in df.columns if "outcome" in c.lower() or "label" in c.lower()), df.columns[-1])

    df = df.dropna(subset=[score_col, outcome_col])
    scores = pd.to_numeric(df[score_col], errors="coerce").fillna(0).values
    labels = pd.to_numeric(df[outcome_col], errors="coerce").astype(bool).values

    fpr, tpr, auc = compute_roc(scores, labels)
    print(f"  AUC = {auc:.4f}")

    fig = go.Figure()

    # Chance diagonal
    fig.add_trace(go.Scatter(
        x=[0, 1], y=[0, 1],
        mode="lines", name="Chance (AUC=0.5)",
        line=dict(color=GRID, width=3.5, dash="dot"),
        hoverinfo="skip",
    ))

    # ROC curve
    fig.add_trace(go.Scatter(
        x=fpr, y=tpr,
        mode="lines",
        name=f"Glucose score (AUC={auc:.3f})",
        line=dict(color=VIOLET, width=2.5),
        fill="tozeroy",
        fillcolor="rgba(132,94,238,0.10)",
        hovertemplate="FPR=%{x:.3f}<br>TPR=%{y:.3f}<extra></extra>",
    ))

    fig.add_annotation(
        x=0.6, y=0.25,
        text=f"AUC = {auc:.3f}",
        showarrow=False,
        font=dict(size=14, color=VIOLET),
        bgcolor="rgba(255,255,255,0.8)",
        bordercolor=VIOLET, borderwidth=1,
    )

    fig.update_layout(
        title=dict(text="ROC Curve — Pima Diabetes (Glucose score)", x=0.5),
        xaxis=dict(title="False Positive Rate", range=[0, 1]),
        yaxis=dict(title="True Positive Rate", range=[0, 1.02]),
        legend=dict(orientation="h", y=1.08),
        margin=dict(t=60, b=50, l=70, r=40),
        height=460,
    )
    apply_theme(fig)
    return fig


fig = generate()
fig.show()
Made with Plotly