
Sankey energy flow
LLNL US energy flow, 2023 (full 4-stage reproduction)
Example from the compendium of canonical charts
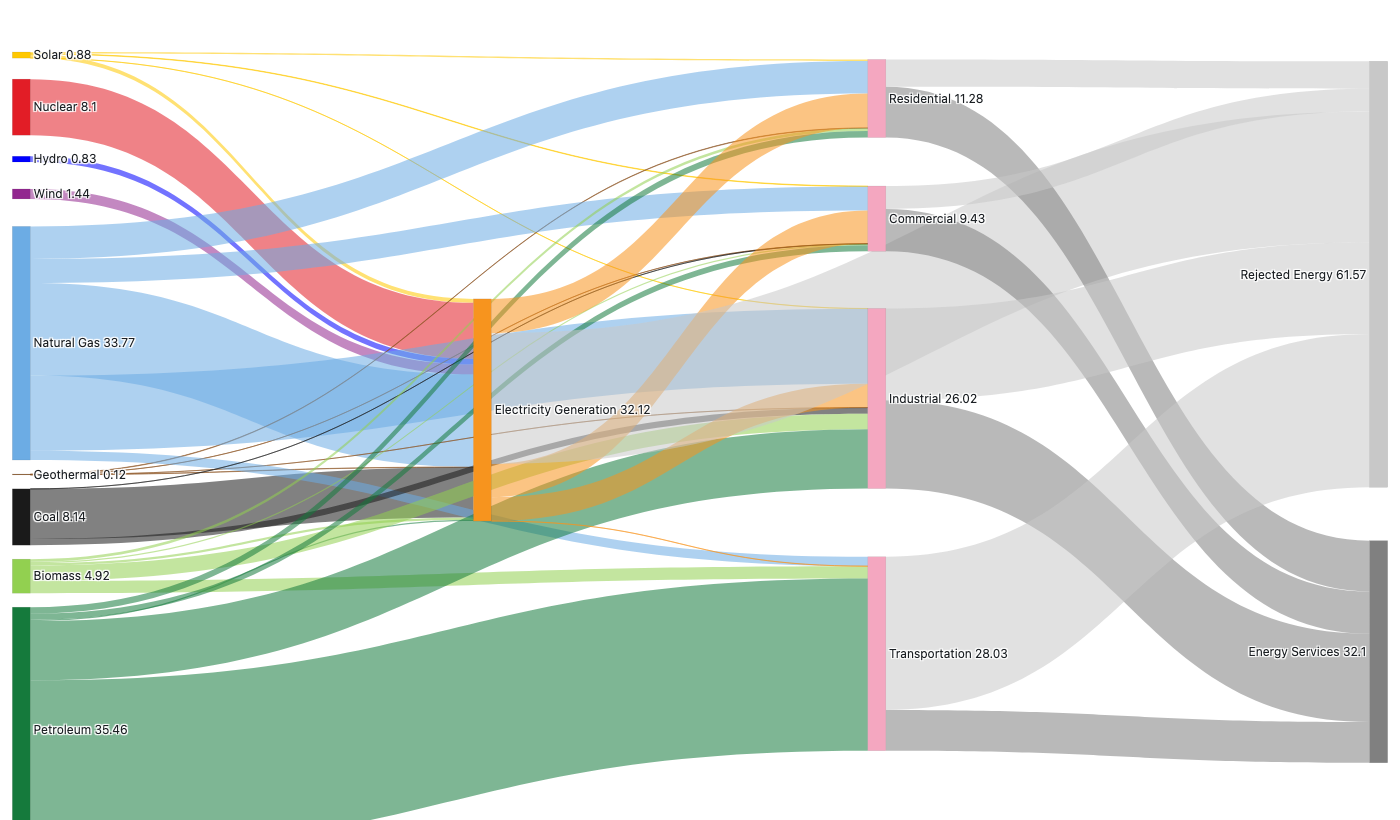
Python Code
"""Sankey energy flow — LLNL US energy flow, 2023 (full 4-stage reproduction)."""
from pathlib import Path

# ── Palette + theme (matching the Plotly Studio gallery these charts ship in) ──
VIOLET, TEAL, GREEN, PINK, ORANGE = "#845EEE", "#52B3D0", "#55B685", "#DA5597", "#E9A23B"
PRIMARY, SECONDARY = VIOLET, TEAL
COLORWAY = [VIOLET, TEAL, GREEN, PINK, ORANGE]
BG, TEXT, GRID, MUTED = "#ffffff", "#1c2024", "#d9d9e0", "#60646c"
FONT = "Inter, -apple-system, BlinkMacSystemFont, sans-serif"
COLORSCALE = [[0, "rgba(132, 94, 238, 0.05)"], [1, "rgba(132, 94, 238, 0.9)"]]


def apply_theme(fig):
    """Light gallery theme: white background, Inter font, soft gridlines."""
    fig.update_layout(
        paper_bgcolor=BG, plot_bgcolor=BG, colorway=COLORWAY,
        font=dict(family=FONT, color=TEXT, size=12),
        legend=dict(font=dict(color=TEXT)),
        hoverlabel=dict(bgcolor="#f0f0f3", font=dict(color=TEXT, family=FONT), bordercolor=GRID),
    )
    fig.update_xaxes(gridcolor=GRID, linecolor=GRID, zerolinecolor=GRID)
    fig.update_yaxes(gridcolor=GRID, linecolor=GRID, zerolinecolor=GRID)


def fetch_csv(url, **kwargs):
    import io
    import pandas as pd
    import requests
    r = requests.get(url, timeout=60)
    r.raise_for_status()
    return pd.read_csv(io.StringIO(r.text), **kwargs)


def fetch_json(url):
    import requests
    r = requests.get(url, timeout=60)
    r.raise_for_status()
    return r.json()

import plotly.graph_objects as go


# Source: Lawrence Livermore National Laboratory, "United States Energy
# Consumption in 2023: 93.7 Quads" (LLNL, Jan 2026; data from DOE/EIA SEDS).
# Every flow value below is transcribed from that chart. Units = quads.
# Four stages: 9 primary sources → electricity generation → 4 end-use sectors
# → energy services (useful) vs rejected energy (waste). Iconic LLNL colors.

# Node indices
SOLAR, NUCLEAR, HYDRO, WIND, GEO, NGAS, COAL, BIOMASS, PETRO = range(9)
ELEC = 9
RES, COM, IND, TRANS = 10, 11, 12, 13
SERVICES, REJECTED = 14, 15

NODES = [
    "Solar 0.88",                    # 0
    "Nuclear 8.1",                   # 1
    "Hydro 0.83",                    # 2
    "Wind 1.44",                     # 3
    "Geothermal 0.12",               # 4
    "Natural Gas 33.77",             # 5
    "Coal 8.14",                     # 6
    "Biomass 4.92",                  # 7
    "Petroleum 35.46",               # 8
    "Electricity Generation 32.12",  # 9
    "Residential 11.28",             # 10
    "Commercial 9.43",               # 11
    "Industrial 26.02",              # 12
    "Transportation 28.03",          # 13
    "Energy Services 32.1",          # 14
    "Rejected Energy 61.57",         # 15
]

# (source, target, quads)
FLOWS = [
    # Sources → Electricity Generation
    (SOLAR, ELEC, 0.56), (NUCLEAR, ELEC, 8.1), (HYDRO, ELEC, 0.83),
    (WIND, ELEC, 1.44), (GEO, ELEC, 0.04), (NGAS, ELEC, 13.37),
    (COAL, ELEC, 7.25), (BIOMASS, ELEC, 0.34), (PETRO, ELEC, 0.18),
    # Sources → end-use sectors (direct, non-electric)
    (SOLAR, RES, 0.23), (SOLAR, COM, 0.07), (SOLAR, IND, 0.02),
    (GEO, RES, 0.06), (GEO, COM, 0.01), (GEO, IND, 0.01),
    (NGAS, RES, 4.71), (NGAS, COM, 3.48), (NGAS, IND, 10.86), (NGAS, TRANS, 1.35),
    (COAL, COM, 0.01), (COAL, IND, 0.88),
    (BIOMASS, RES, 0.39), (BIOMASS, COM, 0.18), (BIOMASS, IND, 2.23), (BIOMASS, TRANS, 1.78),
    (PETRO, RES, 0.95), (PETRO, COM, 0.87), (PETRO, IND, 8.59), (PETRO, TRANS, 24.88),
    # Electricity Generation → sectors + rejected
    (ELEC, RES, 4.95), (ELEC, COM, 4.8), (ELEC, IND, 3.44), (ELEC, TRANS, 0.02),
    (ELEC, REJECTED, 18.91),
    # Sectors → energy services (useful) + rejected (waste)
    (RES, SERVICES, 7.33), (RES, REJECTED, 3.95),
    (COM, SERVICES, 6.13), (COM, REJECTED, 3.3),
    (IND, SERVICES, 12.75), (IND, REJECTED, 13.27),
    (TRANS, SERVICES, 5.89), (TRANS, REJECTED, 22.14),
]

# Iconic LLNL palette, keyed by node index.
NODE_COLORS = [
    "#FFC800",  # Solar — yellow
    "#E21D26",  # Nuclear — red
    "#0000FF",  # Hydro — blue
    "#92278F",  # Wind — purple
    "#8C5523",  # Geothermal — brown
    "#6CACE4",  # Natural Gas — sky blue
    "#1A1A1A",  # Coal — black
    "#92D050",  # Biomass — light green
    "#157A3C",  # Petroleum — dark green
    "#F7941E",  # Electricity Generation — orange
    "#F4A7C0", "#F4A7C0", "#F4A7C0", "#F4A7C0",  # sectors — pink
    "#808080",  # Energy Services — dark grey
    "#C8C8C8",  # Rejected Energy — light grey
]


def _rgba(hex_color: str, alpha: float) -> str:
    h = hex_color.lstrip("#")
    r, g, b = (int(h[i:i + 2], 16) for i in (0, 2, 4))
    return f"rgba({r},{g},{b},{alpha})"


# Column layout: source column, electricity hub, sectors, end-use sinks.
COLUMNS = [
    (0.001, [SOLAR, NUCLEAR, HYDRO, WIND, GEO, NGAS, COAL, BIOMASS, PETRO]),
    (0.34,  [ELEC]),
    (0.63,  [RES, COM, IND, TRANS]),
    (0.999, [REJECTED, SERVICES]),
]


def _layout_positions():
    """Stack each column top→bottom, height-weighted by node total, with gaps."""
    node_total = [0.0] * len(NODES)
    for s, t, v in FLOWS:
        node_total[s] += v
        node_total[t] += v  # sinks/sectors sized by inflow
    # sources have no inflow → size by outflow (already counted via s)
    x_pos = [0.0] * len(NODES)
    y_pos = [0.0] * len(NODES)
    for x, members in COLUMNS:
        sizes = [node_total[n] for n in members]
        gap = sum(sizes) * 0.06
        span = sum(sizes) + gap * (len(members) - 1)
        run = 0.0
        for n, sz in zip(members, sizes):
            center = run + sz / 2
            x_pos[n] = x
            y_pos[n] = 0.03 + (center / span) * 0.94
            run += sz + gap
    return x_pos, y_pos


def generate():
    print("building LLNL US energy 2023 four-stage Sankey …")

    sources = [f[0] for f in FLOWS]
    targets = [f[1] for f in FLOWS]
    values  = [f[2] for f in FLOWS]
    x_pos, y_pos = _layout_positions()

    # LLNL link coloring: useful energy = dark grey, rejected = light grey,
    # electricity = orange, everything else tinted by its source.
    link_colors = []
    for s, t, _ in FLOWS:
        if t == REJECTED:
            link_colors.append(_rgba("#C8C8C8", 0.55))
        elif t == SERVICES:
            link_colors.append(_rgba("#808080", 0.55))
        elif s == ELEC:
            link_colors.append(_rgba("#F7941E", 0.55))
        else:
            link_colors.append(_rgba(NODE_COLORS[s], 0.55))

    fig = go.Figure(go.Sankey(
        arrangement="snap",
        valueformat=".2f",
        valuesuffix=" quads",
        node=dict(
            label=NODES,
            color=NODE_COLORS,
            x=x_pos, y=y_pos,
            pad=14, thickness=18,
            line=dict(color="rgba(0,0,0,0.15)", width=0.5),
            hovertemplate="%{label}<extra></extra>",
        ),
        link=dict(
            source=sources,
            target=targets,
            value=values,
            color=link_colors,
            hovertemplate="%{source.label} → %{target.label}: %{value}<extra></extra>",
        ),
    ))

    fig.update_layout(
        margin=dict(t=30, b=30, l=20, r=20),
        height=640,
        font=dict(size=10),
    )
    apply_theme(fig)
    return fig


fig = generate()
fig.show()
Made with Plotly