
SF daily high/low temperature: 7 past days + 5 forecast days
Weather
Example from the compendium of canonical charts
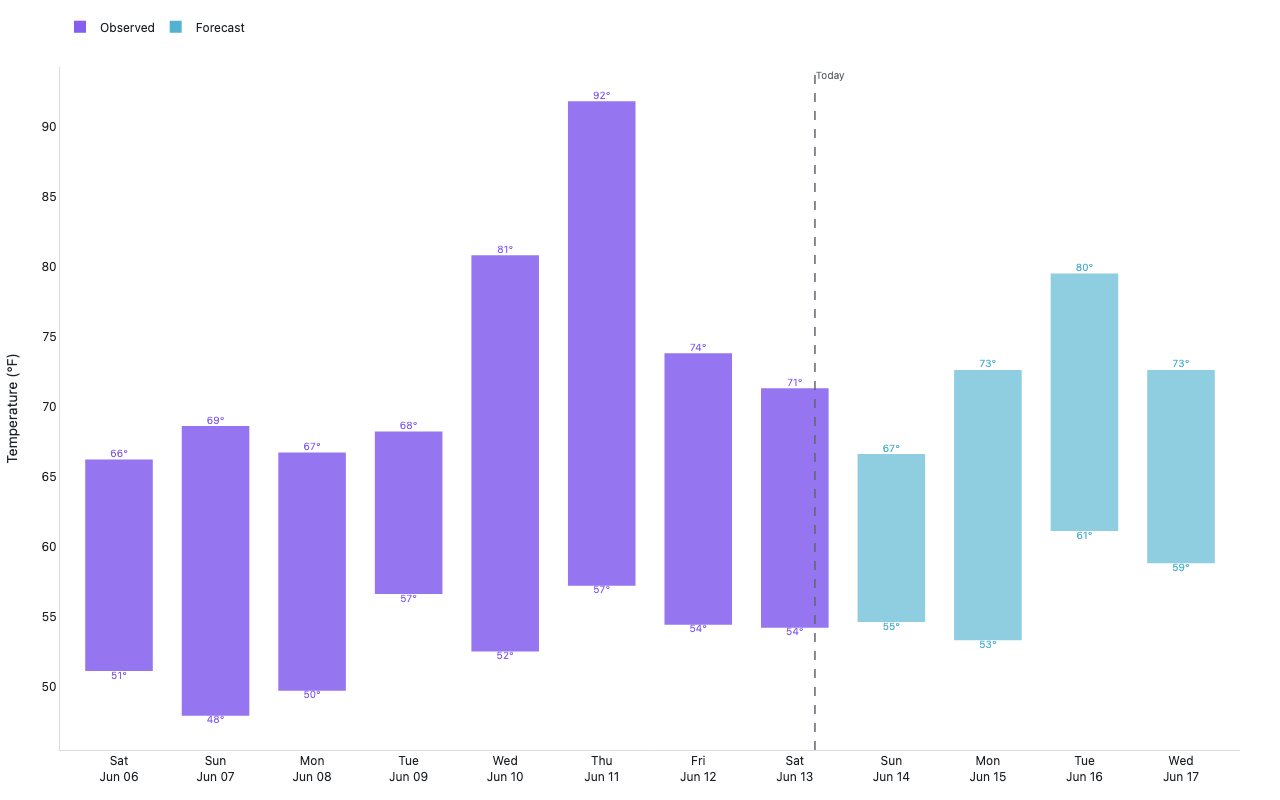
Python Code
"""Weather — SF daily high/low temperature: 7 past days + 5 forecast days."""
from pathlib import Path

# ── Palette + theme (matching the Plotly Studio gallery these charts ship in) ──
VIOLET, TEAL, GREEN, PINK, ORANGE = "#845EEE", "#52B3D0", "#55B685", "#DA5597", "#E9A23B"
PRIMARY, SECONDARY = VIOLET, TEAL
COLORWAY = [VIOLET, TEAL, GREEN, PINK, ORANGE]
BG, TEXT, GRID, MUTED = "#ffffff", "#1c2024", "#d9d9e0", "#60646c"
FONT = "Inter, -apple-system, BlinkMacSystemFont, sans-serif"
COLORSCALE = [[0, "rgba(132, 94, 238, 0.05)"], [1, "rgba(132, 94, 238, 0.9)"]]


def apply_theme(fig):
    """Light gallery theme: white background, Inter font, soft gridlines."""
    fig.update_layout(
        paper_bgcolor=BG, plot_bgcolor=BG, colorway=COLORWAY,
        font=dict(family=FONT, color=TEXT, size=12),
        legend=dict(font=dict(color=TEXT)),
        hoverlabel=dict(bgcolor="#f0f0f3", font=dict(color=TEXT, family=FONT), bordercolor=GRID),
    )
    fig.update_xaxes(gridcolor=GRID, linecolor=GRID, zerolinecolor=GRID)
    fig.update_yaxes(gridcolor=GRID, linecolor=GRID, zerolinecolor=GRID)


def fetch_csv(url, **kwargs):
    import io
    import pandas as pd
    import requests
    r = requests.get(url, timeout=60)
    r.raise_for_status()
    return pd.read_csv(io.StringIO(r.text), **kwargs)


def fetch_json(url):
    import requests
    r = requests.get(url, timeout=60)
    r.raise_for_status()
    return r.json()

import numpy as np
import pandas as pd
import plotly.graph_objects as go
import requests, warnings


# San Francisco coords — Open-Meteo free API, no key required
OPENMETEO_URL = (
    "https://api.open-meteo.com/v1/forecast"
    "?latitude=37.7749&longitude=-122.4194"
    "&daily=temperature_2m_max,temperature_2m_min,precipitation_sum"
    "&temperature_unit=fahrenheit"
    "&timezone=America%2FLos_Angeles"
    "&past_days=7"
    "&forecast_days=5"
)


def generate():
    print("fetching Open-Meteo SF 7-day past + 5-day forecast …")
    warnings.filterwarnings("ignore")
    try:
        requests.packages.urllib3.disable_warnings()
    except Exception:
        pass

    df = None
    try:
        r = requests.get(OPENMETEO_URL, verify=False, timeout=20)
        if r.status_code == 200:
            data = r.json()
            daily = data.get("daily", {})
            df = pd.DataFrame({
                "date":   pd.to_datetime(daily["time"]),
                "hi":     daily["temperature_2m_max"],
                "lo":     daily["temperature_2m_min"],
                "precip": daily.get("precipitation_sum", [0] * len(daily["time"])),
            }).dropna(subset=["hi", "lo"])
            print(f"  {len(df)} days, {df['date'].min().date()} – {df['date'].max().date()}")
    except Exception as e:
        print(f"  fetch failed ({e}), using synthetic SF data")

    if df is None:
        # Synthetic SF June weather: cool mornings, mild afternoons
        today = pd.Timestamp.today().normalize()
        dates = pd.date_range(today - pd.Timedelta(days=7), periods=12, freq="D")
        rng = np.random.default_rng(137)
        hi = 62 + 6 * np.sin(np.arange(12) * 0.7) + rng.normal(0, 2, 12)
        lo = 52 + 4 * np.sin(np.arange(12) * 0.5) + rng.normal(0, 1.5, 12)
        df = pd.DataFrame({"date": dates, "hi": hi, "lo": lo, "precip": [0.0] * 12})

    today = pd.Timestamp.today().normalize()
    df["is_forecast"] = df["date"] > today

    past = df[~df["is_forecast"]]
    fcast = df[df["is_forecast"]]

    fig = go.Figure()

    # Past high/low bars (solid VIOLET)
    if len(past):
        fig.add_trace(go.Bar(
            x=past["date"],
            y=past["hi"] - past["lo"],
            base=past["lo"],
            name="Observed",
            marker=dict(color=VIOLET, opacity=0.85, line=dict(width=0)),
            hovertemplate="%{x|%a %b %d}<br>Hi: %{customdata[0]:.0f}°F  Lo: %{customdata[1]:.0f}°F<extra></extra>",
            customdata=list(zip(past["hi"], past["lo"])),
            width=0.7 * 86400000,
        ))

    # Forecast high/low bars (lighter, dashed look via opacity)
    if len(fcast):
        fig.add_trace(go.Bar(
            x=fcast["date"],
            y=fcast["hi"] - fcast["lo"],
            base=fcast["lo"],
            name="Forecast",
            marker=dict(color=TEAL, opacity=0.65, line=dict(width=0)),
            hovertemplate="%{x|%a %b %d}<br>Hi: %{customdata[0]:.0f}°F  Lo: %{customdata[1]:.0f}°F<extra></extra>",
            customdata=list(zip(fcast["hi"], fcast["lo"])),
            width=0.7 * 86400000,
        ))

    # Hi/Lo temperature labels
    all_dates = df["date"]
    hi_colors = [VIOLET if not f else TEAL for f in df["is_forecast"]]
    lo_colors = hi_colors

    fig.add_trace(go.Scatter(
        x=all_dates, y=df["hi"],
        mode="text",
        text=[f"{v:.0f}°" for v in df["hi"]],
        textposition="top center",
        textfont=dict(size=10, color=hi_colors),
        name="High",
        hoverinfo="skip",
        showlegend=False,
    ))
    fig.add_trace(go.Scatter(
        x=all_dates, y=df["lo"],
        mode="text",
        text=[f"{v:.0f}°" for v in df["lo"]],
        textposition="bottom center",
        textfont=dict(size=10, color=lo_colors),
        name="Low",
        hoverinfo="skip",
        showlegend=False,
    ))

    # Divider between past/forecast
    if len(past) and len(fcast):
        divider = today + pd.Timedelta(hours=12)
        fig.add_vline(
            x=divider.value // 10**6,
            line=dict(color=MUTED, width=1.5, dash="dash"),
        )
        fig.add_annotation(
            x=divider.value // 10**6,
            y=1, yref="paper",
            text="Today",
            showarrow=False,
            font=dict(size=10, color=MUTED),
            xanchor="left", yanchor="top",
        )

    fig.update_layout(
        xaxis=dict(
            type="date",
            tickformat="%a\n%b %d",
            showgrid=False,
            dtick=86400000,
        ),
        yaxis=dict(
            title="Temperature (°F)",
            showgrid=False,
            zeroline=False,
        ),
        legend=dict(orientation="h", y=1.08),
        bargap=0.2,
        margin=dict(t=50, b=50, l=60, r=40),
        height=420,
    )
    apply_theme(fig)
    return fig


fig = generate()
fig.show()
Made with Plotly