
Shear force and bending moment diagram
Structural Engineering
Example from the compendium of canonical charts
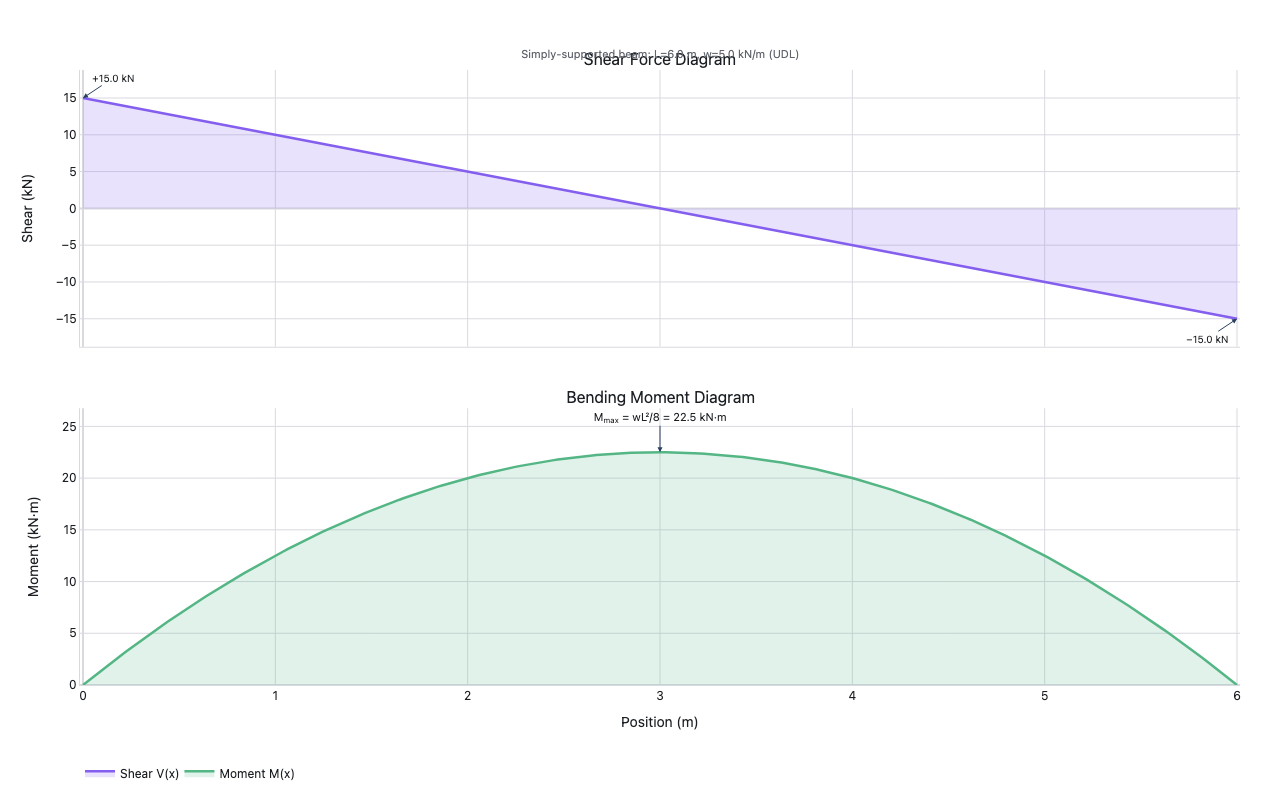
Python Code
"""Structural Engineering — Shear force and bending moment diagram."""
from pathlib import Path

# ── Palette + theme (matching the Plotly Studio gallery these charts ship in) ──
VIOLET, TEAL, GREEN, PINK, ORANGE = "#845EEE", "#52B3D0", "#55B685", "#DA5597", "#E9A23B"
PRIMARY, SECONDARY = VIOLET, TEAL
COLORWAY = [VIOLET, TEAL, GREEN, PINK, ORANGE]
BG, TEXT, GRID, MUTED = "#ffffff", "#1c2024", "#d9d9e0", "#60646c"
FONT = "Inter, -apple-system, BlinkMacSystemFont, sans-serif"
COLORSCALE = [[0, "rgba(132, 94, 238, 0.05)"], [1, "rgba(132, 94, 238, 0.9)"]]


def apply_theme(fig):
    """Light gallery theme: white background, Inter font, soft gridlines."""
    fig.update_layout(
        paper_bgcolor=BG, plot_bgcolor=BG, colorway=COLORWAY,
        font=dict(family=FONT, color=TEXT, size=12),
        legend=dict(font=dict(color=TEXT)),
        hoverlabel=dict(bgcolor="#f0f0f3", font=dict(color=TEXT, family=FONT), bordercolor=GRID),
    )
    fig.update_xaxes(gridcolor=GRID, linecolor=GRID, zerolinecolor=GRID)
    fig.update_yaxes(gridcolor=GRID, linecolor=GRID, zerolinecolor=GRID)


def fetch_csv(url, **kwargs):
    import io
    import pandas as pd
    import requests
    r = requests.get(url, timeout=60)
    r.raise_for_status()
    return pd.read_csv(io.StringIO(r.text), **kwargs)


def fetch_json(url):
    import requests
    r = requests.get(url, timeout=60)
    r.raise_for_status()
    return r.json()

import numpy as np
import plotly.graph_objects as go
from plotly.subplots import make_subplots

L = 6.0   # beam length (m)
w = 5.0   # UDL (kN/m)


def generate():
    x = np.linspace(0, L, 300)

    # Simply-supported beam with UDL
    R = w * L / 2          # reaction at each support
    V = R - w * x          # shear force
    M = R * x - w * x**2 / 2  # bending moment

    M_max = w * L**2 / 8   # at midspan

    fig = make_subplots(
        rows=2, cols=1,
        shared_xaxes=True,
        vertical_spacing=0.10,
        subplot_titles=["Shear Force Diagram", "Bending Moment Diagram"],
    )

    # Row 1: Shear force
    fig.add_trace(go.Scatter(
        x=x, y=V,
        mode="lines",
        line=dict(color=VIOLET, width=2.5),
        fill="tozeroy",
        fillcolor="rgba(132, 94, 238, 0.18)",
        name="Shear V(x)",
        hovertemplate="x=%{x:.2f} m<br>V=%{y:.2f} kN<extra></extra>",
    ), row=1, col=1)

    # Annotate peak shear at x=0 and x=L
    fig.add_annotation(x=0, y=R, text=f"+{R:.1f} kN", showarrow=True,
                       arrowhead=2, ax=30, ay=-20, row=1, col=1,
                       font=dict(size=10))
    fig.add_annotation(x=L, y=-R, text=f"−{R:.1f} kN", showarrow=True,
                       arrowhead=2, ax=-30, ay=20, row=1, col=1,
                       font=dict(size=10))

    # Row 2: Bending moment (sagging positive, plotted downward convention — use positive)
    fig.add_trace(go.Scatter(
        x=x, y=M,
        mode="lines",
        line=dict(color=GREEN, width=2.5),
        fill="tozeroy",
        fillcolor="rgba(85, 182, 133, 0.18)",
        name="Moment M(x)",
        hovertemplate="x=%{x:.2f} m<br>M=%{y:.2f} kN·m<extra></extra>",
    ), row=2, col=1)

    # Annotate max moment at midspan
    fig.add_annotation(
        x=L/2, y=M_max,
        text=f"M<sub>max</sub> = wL²/8 = {M_max:.1f} kN·m",
        showarrow=True, arrowhead=2,
        ax=0, ay=-35,
        row=2, col=1,
        font=dict(size=11),
    )

    fig.update_xaxes(title_text="Position (m)", row=2, col=1)
    fig.update_yaxes(title_text="Shear (kN)", row=1, col=1)
    fig.update_yaxes(title_text="Moment (kN·m)", row=2, col=1)

    fig.update_layout(
        legend=dict(orientation="h", y=-0.12),
        margin=dict(t=70, b=60, l=80, r=40),
        annotations=fig.layout.annotations + (
            dict(
                x=0.5, y=1.04, xref="paper", yref="paper",
                text=f"Simply-supported beam: L={L} m, w={w} kN/m (UDL)",
                showarrow=False, font=dict(size=11, color="#60646c"),
            ),
        ),
    )
    apply_theme(fig)
    return fig


fig = generate()
fig.show()
Made with Plotly