
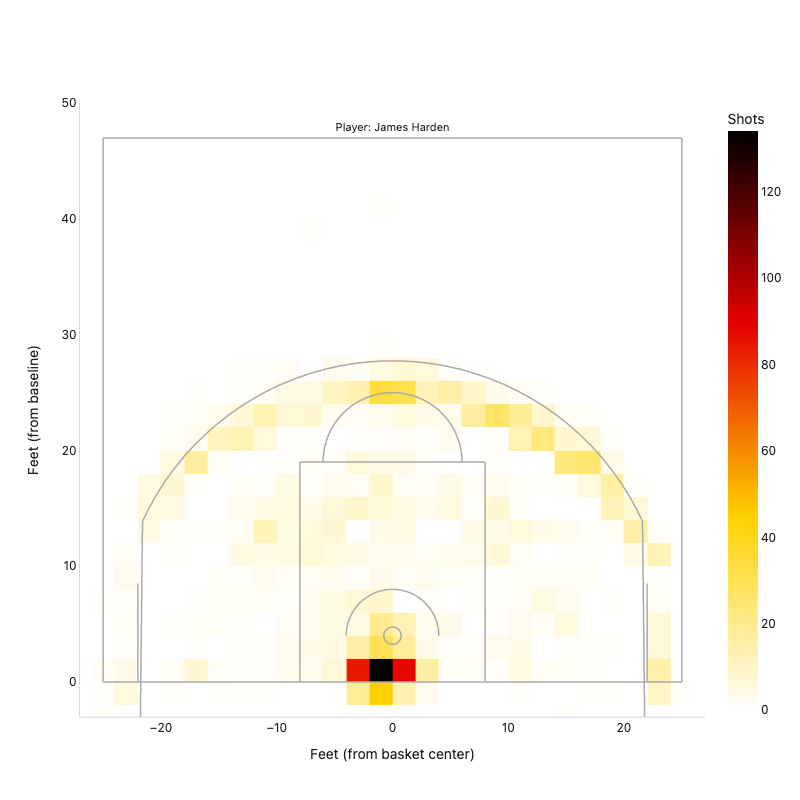
Shot chart with half-court outline and Histogram2d
Basketball
Example from the compendium of canonical charts
Python Code
"""Basketball — Shot chart with half-court outline and Histogram2d."""
from pathlib import Path

# ── Palette + theme (matching the Plotly Studio gallery these charts ship in) ──
VIOLET, TEAL, GREEN, PINK, ORANGE = "#845EEE", "#52B3D0", "#55B685", "#DA5597", "#E9A23B"
PRIMARY, SECONDARY = VIOLET, TEAL
COLORWAY = [VIOLET, TEAL, GREEN, PINK, ORANGE]
BG, TEXT, GRID, MUTED = "#ffffff", "#1c2024", "#d9d9e0", "#60646c"
FONT = "Inter, -apple-system, BlinkMacSystemFont, sans-serif"
COLORSCALE = [[0, "rgba(132, 94, 238, 0.05)"], [1, "rgba(132, 94, 238, 0.9)"]]


def apply_theme(fig):
    """Light gallery theme: white background, Inter font, soft gridlines."""
    fig.update_layout(
        paper_bgcolor=BG, plot_bgcolor=BG, colorway=COLORWAY,
        font=dict(family=FONT, color=TEXT, size=12),
        legend=dict(font=dict(color=TEXT)),
        hoverlabel=dict(bgcolor="#f0f0f3", font=dict(color=TEXT, family=FONT), bordercolor=GRID),
    )
    fig.update_xaxes(gridcolor=GRID, linecolor=GRID, zerolinecolor=GRID)
    fig.update_yaxes(gridcolor=GRID, linecolor=GRID, zerolinecolor=GRID)


def fetch_csv(url, **kwargs):
    import io
    import pandas as pd
    import requests
    r = requests.get(url, timeout=60)
    r.raise_for_status()
    return pd.read_csv(io.StringIO(r.text), **kwargs)


def fetch_json(url):
    import requests
    r = requests.get(url, timeout=60)
    r.raise_for_status()
    return r.json()

import numpy as np
import pandas as pd
import plotly.graph_objects as go
import io, requests, warnings


URL = "https://raw.githubusercontent.com/sealneaward/nba-movement-data/master/data/shots/shots.csv"


def arc(cx, cy, r, theta_start, theta_end, n=100):
    t = np.linspace(np.radians(theta_start), np.radians(theta_end), n)
    return cx + r * np.cos(t), cy + r * np.sin(t)


def build_court_shapes():
    shapes = []

    def line(x0, y0, x1, y1):
        return dict(type="line", x0=x0, y0=y0, x1=x1, y1=y1,
                    line=dict(color="#aaaaaa", width=1.5))

    def path(pts_x, pts_y):
        p = "M " + " L ".join(f"{x:.2f},{y:.2f}" for x, y in zip(pts_x, pts_y))
        return dict(type="path", path=p, line=dict(color="#aaaaaa", width=1.5),
                    fillcolor="rgba(0,0,0,0)")

    # Court boundary
    shapes += [
        line(-25, 0, 25, 0),
        line(-25, 0, -25, 47),
        line(25, 0, 25, 47),
        line(-25, 47, 25, 47),
    ]
    # Paint
    shapes += [
        line(-8, 0, -8, 19),
        line(8, 0, 8, 19),
        line(-8, 19, 8, 19),
    ]
    # Free throw circle
    t = np.linspace(0, np.pi, 80)
    shapes.append(path(6 * np.cos(t), 19 + 6 * np.sin(t)))
    # Restricted area arc
    ra_x, ra_y = arc(0, 4, 4, 0, 180)
    shapes.append(path(ra_x, ra_y))
    # 3-point corners
    shapes += [line(-22, 0, -22, 8.5), line(22, 0, 22, 8.5)]
    # 3-point arc
    tp_x, tp_y = arc(0, 4, 23.75, -68, 248)
    mask = np.abs(tp_x) <= 22
    shapes.append(path(tp_x[mask], tp_y[mask]))
    # Hoop
    t2 = np.linspace(0, 2 * np.pi, 40)
    shapes.append(path(0.75 * np.cos(t2), 4 + 0.75 * np.sin(t2)))
    return shapes


def generate():
    warnings.filterwarnings("ignore")
    try:
        requests.packages.urllib3.disable_warnings()
    except Exception:
        pass

    df = None
    top_player = "Synthetic Player"
    try:
        r = requests.get(URL, verify=False, timeout=30)
        r.raise_for_status()
        df = pd.read_csv(io.StringIO(r.text),
                         usecols=["LOC_X", "LOC_Y", "SHOT_MADE_FLAG", "PLAYER_NAME"])
        top_player = df["PLAYER_NAME"].value_counts().index[0]
        df = df[df["PLAYER_NAME"] == top_player].copy()
        df["x"] = df["LOC_X"] / 10.0
        df["y"] = df["LOC_Y"] / 10.0
        print(f"Loaded {len(df)} shots for {top_player}")
    except Exception as e:
        print(f"Download failed ({e}), using synthetic shot data")
        df = None

    if df is None:
        RNG = np.random.default_rng(42)
        n = 600
        zones = [
            (0, 5, 3, 2, 0.15),
            (-8, 8, 3, 2, 0.10),
            (8, 8, 3, 2, 0.10),
            (-22, 5, 1, 3, 0.12),
            (22, 5, 1, 3, 0.12),
            (-19, 22, 3, 2, 0.12),
            (19, 22, 3, 2, 0.12),
            (0, 24, 4, 2, 0.17),
        ]
        xs, ys, made = [], [], []
        weights = np.array([z[4] for z in zones])
        weights /= weights.sum()
        for i, (cx, cy, sx, sy, _) in enumerate(zones):
            n_z = int(n * weights[i])
            xs.extend(RNG.normal(cx, sx, n_z))
            ys.extend(RNG.normal(cy, sy, n_z))
            made.extend(RNG.binomial(1, 0.45, n_z))
        df = pd.DataFrame({"x": xs, "y": ys, "SHOT_MADE_FLAG": made})

    court_shapes = build_court_shapes()

    fig = go.Figure()
    fig.add_trace(go.Histogram2d(
        x=df["x"].values,
        y=df["y"].values,
        histfunc="count",
        colorscale="Hot",
        reversescale=True,
        nbinsx=30,
        nbinsy=30,
        zmin=0,
        colorbar=dict(title="Shots"),
        name="Shot density",
        xbingroup="x",
        ybingroup="y",
    ))

    fig.update_layout(
        shapes=court_shapes,
        xaxis=dict(
            title="Feet (from basket center)",
            range=[-27, 27],
            showgrid=False,
            zeroline=False,
        ),
        yaxis=dict(
            title="Feet (from baseline)",
            range=[-3, 50],
            showgrid=False,
            zeroline=False,
            scaleanchor="x",
            scaleratio=1,
            constrain="domain",
        ),
        annotations=[dict(x=0, y=48, text=f"Player: {top_player}",
                          showarrow=False, font=dict(size=11))],
    )
    apply_theme(fig)
    return fig


fig = generate()
fig.show()
Made with Plotly